SciChart® the market leader in Fast WPF Charts, WPF 3D Charts, and iOS Chart & Android Chart Components
SciChart WPF ships with hundreds of WPF Chart Examples which you can browse, play with, view the source-code and even export each WPF Chart Example to a stand-alone Visual Studio solution. All of this is possible with the new and improved SciChart WPF Examples Suite, which ships as part of the SciChart WPF SDK.
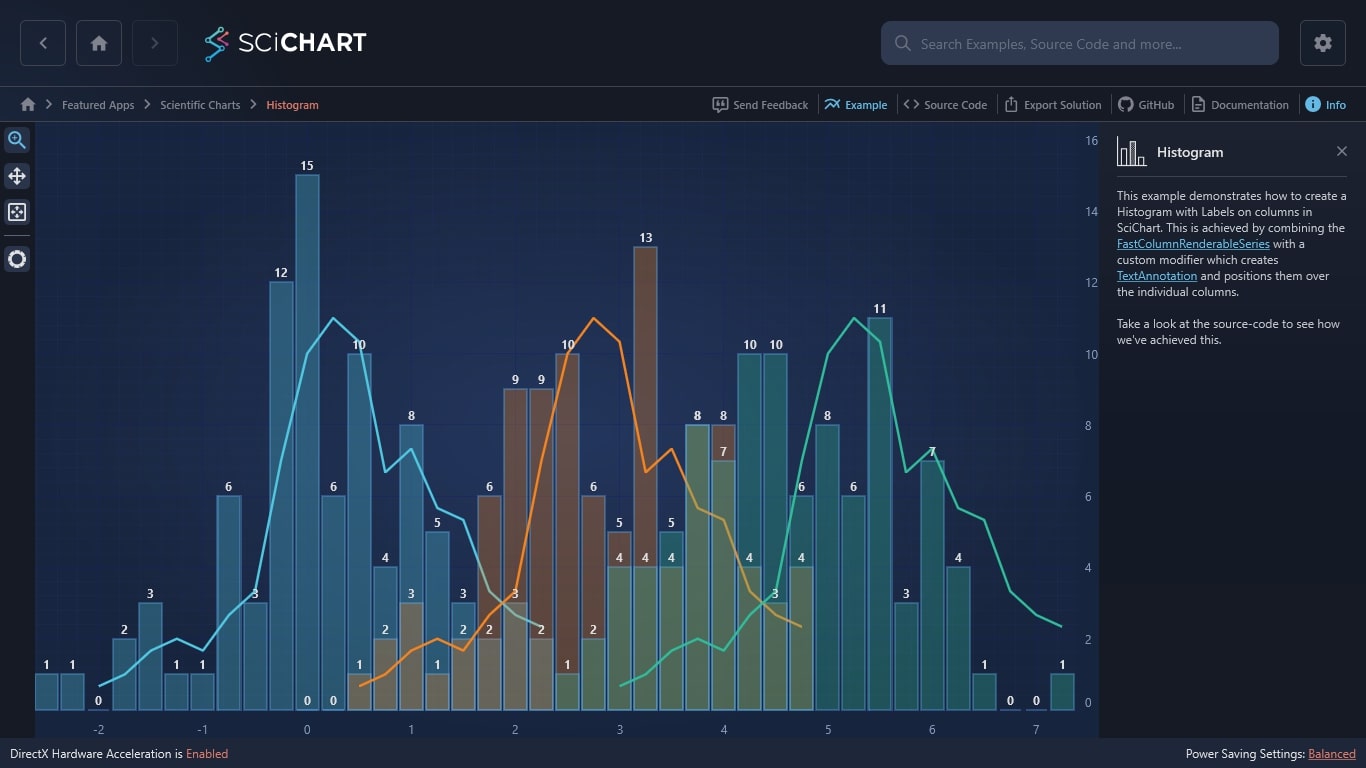
This example demonstrates how to create a Histogram with Labels on columns in SciChart. This is achieved by combining the FastColumnRenderableSeries with a custom modifier which creates TextAnnotation and positions them over the individual columns.
Take a look at the source-code to see how we’ve achieved this.
The C#/WPF source code for the WPF Chart Histogram Demo example is included below (Scroll down!).
Did you know you can also view the source code from one of the following sources as well?
// ************************************************************************************* // SCICHART® Copyright SciChart Ltd. 2011-2018. All rights reserved. // // Web: http://www.scichart.com // Support: support@scichart.com // Sales: sales@scichart.com // // CustomAnnotationModifier.cs is part of the SCICHART® Examples. Permission is hereby granted // to modify, create derivative works, distribute and publish any part of this source // code whether for commercial, private or personal use. // // The SCICHART® examples are distributed in the hope that they will be useful, but // without any warranty. It is provided "AS IS" without warranty of any kind, either // expressed or implied. // ************************************************************************************* using System.Collections; using System.Windows; using SciChart.Charting.ChartModifiers; namespace SciChart.Examples.Examples.SeeFeaturedApplication.Histogram { public class CustomAnnotationModifier : ChartModifierBase { public static readonly DependencyProperty LabelsSourceProperty = DependencyProperty.Register("LabelsSource", typeof(IEnumerable), typeof(CustomAnnotationModifier), new PropertyMetadata(null, OnLabelsSourceChanged)); public IEnumerable LabelsSource { get { return (IEnumerable)GetValue(LabelsSourceProperty); } set { SetValue(LabelsSourceProperty, value); } } /// <summary> /// Called when the Chart Modifier is attached to the Chart Surface /// </summary> public override void OnAttached() { base.OnAttached(); // Catch the condition where LabelsSource binds before chart is shown. Rebuild annotations if (LabelsSource != null && base.ParentSurface.Annotations.Count == 0) { RebuildAnnotations(); } } private static void OnLabelsSourceChanged(DependencyObject d, DependencyPropertyChangedEventArgs e) { var modifier = (CustomAnnotationModifier) d; var newValue = e.NewValue as IEnumerable; if (newValue != null) { modifier.RebuildAnnotations(); } } private void RebuildAnnotations() { if (base.ParentSurface != null && LabelsSource != null) { // Take a look at the base class, ChartModifierBase for a wealth of API methods and properties to manipulate the SciChartSurface var annotationCollection = base.ParentSurface.Annotations; annotationCollection.Clear(); foreach (var item in LabelsSource) { annotationCollection.Add(new HistogramLabelAnnotation { DataContext = item }); } } } } }
<s:TextAnnotation x:Class="SciChart.Examples.Examples.SeeFeaturedApplication.Histogram.HistogramLabelAnnotation" xmlns="http://schemas.microsoft.com/winfx/2006/xaml/presentation" xmlns:x="http://schemas.microsoft.com/winfx/2006/xaml" xmlns:s="http://schemas.abtsoftware.co.uk/scichart" Foreground="#ffdddddd" FontWeight="Bold" FontSize="12" HorizontalAnchorPoint="Center" Text="{Binding LabelText}" VerticalAnchorPoint="Bottom" X1="{Binding X1}" Y1="{Binding Y1}" />
// ************************************************************************************* // SCICHART® Copyright SciChart Ltd. 2011-2018. All rights reserved. // // Web: http://www.scichart.com // Support: support@scichart.com // Sales: sales@scichart.com // // HistogramLabelAnnotation.xaml.cs is part of the SCICHART® Examples. Permission is hereby granted // to modify, create derivative works, distribute and publish any part of this source // code whether for commercial, private or personal use. // // The SCICHART® examples are distributed in the hope that they will be useful, but // without any warranty. It is provided "AS IS" without warranty of any kind, either // expressed or implied. // ************************************************************************************* using SciChart.Charting.Visuals.Annotations; namespace SciChart.Examples.Examples.SeeFeaturedApplication.Histogram { /// <summary> /// Interaction logic for CustomTextAnnotation.xaml /// </summary> public partial class HistogramLabelAnnotation : TextAnnotation { public HistogramLabelAnnotation() { InitializeComponent(); } } }
// ************************************************************************************* // SCICHART® Copyright SciChart Ltd. 2011-2018. All rights reserved. // // Web: http://www.scichart.com // Support: support@scichart.com // Sales: sales@scichart.com // // HistogramLabelViewModel.cs is part of the SCICHART® Examples. Permission is hereby granted // to modify, create derivative works, distribute and publish any part of this source // code whether for commercial, private or personal use. // // The SCICHART® examples are distributed in the hope that they will be useful, but // without any warranty. It is provided "AS IS" without warranty of any kind, either // expressed or implied. // ************************************************************************************* using System; namespace SciChart.Examples.Examples.SeeFeaturedApplication.Histogram { public class HistogramLabelViewModel { public HistogramLabelViewModel(IComparable x1, IComparable y1, string text) { X1 = x1; Y1 = y1; LabelText = text; } /// <summary> /// LabelText will allow us to bind to TextAnnotation.Text /// </summary> public string LabelText { get; set; } /// <summary> /// X1 defines the X Data-Value for positioning the annotation /// </summary> public IComparable X1 { get; set; } /// <summary> /// Y1 defines the Y Data-Value for positioning the annotation /// </summary> public IComparable Y1 { get; set; } } }
<UserControl x:Class="SciChart.Examples.Examples.SeeFeaturedApplication.Histogram.HistogramView" xmlns="http://schemas.microsoft.com/winfx/2006/xaml/presentation" xmlns:x="http://schemas.microsoft.com/winfx/2006/xaml" xmlns:d="http://schemas.microsoft.com/expression/blend/2008" xmlns:ex="http://schemas.abtsoftware.co.uk/scichart/exampleExternals" xmlns:mc="http://schemas.openxmlformats.org/markup-compatibility/2006" xmlns:s="http://schemas.abtsoftware.co.uk/scichart" xmlns:histogram="clr-namespace:SciChart.Examples.Examples.SeeFeaturedApplication.Histogram" d:DesignHeight="400" d:DesignWidth="600" mc:Ignorable="d"> <Grid> <Grid.ColumnDefinitions> <ColumnDefinition Width="Auto" /> <ColumnDefinition Width="*" /> </Grid.ColumnDefinitions> <!-- The SciChartInteractionToolbar adds zoom, pan, zoom extents and rotate functionality --> <!-- to the chart and is included for example purposes. --> <!-- If you wish to know how to zoom and pan a chart then do a search for Zoom Pan in the Examples suite! --> <ex:SciChartInteractionToolbar TargetSurface="{Binding Source={x:Reference Name=SciChart}}" /> <!-- Shows the SciChartSurface and binds ZoomHistoryManager to the instance in the viewmodel --> <!-- This is what we use to control zoom history as well as Undo Redo --> <s:SciChartSurface x:Name="SciChart" Grid.Column="1" RenderableSeries="{s:SeriesBinding RenderableSeriesViewModels}"> <!-- Styles.xaml resource keys must match StyleKey in RenderableSeriesViewModel --> <s:SciChartSurface.Resources> <ResourceDictionary Source="Styles.xaml" /> </s:SciChartSurface.Resources> <s:SciChartSurface.XAxis> <s:NumericAxis /> </s:SciChartSurface.XAxis> <s:SciChartSurface.YAxis> <s:NumericAxis GrowBy="0, 0.1" /> </s:SciChartSurface.YAxis> <s:SciChartSurface.ChartModifier> <histogram:CustomAnnotationModifier LabelsSource="{Binding ChartLabels}" /> </s:SciChartSurface.ChartModifier> </s:SciChartSurface> </Grid> </UserControl>
// ************************************************************************************* // SCICHART® Copyright SciChart Ltd. 2011-2016. All rights reserved. // // Web: http://www.scichart.com // Support: support@scichart.com // Sales: sales@scichart.com // // HistogramView.xaml.cs is part of the SCICHART® Examples. Permission is hereby granted // to modify, create derivative works, distribute and publish any part of this source // code whether for commercial, private or personal use. // // The SCICHART® examples are distributed in the hope that they will be useful, but // without any warranty. It is provided "AS IS" without warranty of any kind, either // expressed or implied. // ************************************************************************************* using System.Windows.Controls; namespace SciChart.Examples.Examples.SeeFeaturedApplication.Histogram { /// <summary> /// Interaction logic for HistogramView.xaml /// </summary> public partial class HistogramView : UserControl { public HistogramView() { InitializeComponent(); } } }
// ************************************************************************************* // SCICHART® Copyright SciChart Ltd. 2011-2016. All rights reserved. // // Web: http://www.scichart.com // Support: support@scichart.com // Sales: sales@scichart.com // // HistogramViewModel.cs is part of the SCICHART® Examples. Permission is hereby granted // to modify, create derivative works, distribute and publish any part of this source // code whether for commercial, private or personal use. // // The SCICHART® examples are distributed in the hope that they will be useful, but // without any warranty. It is provided "AS IS" without warranty of any kind, either // expressed or implied. // ************************************************************************************* using System.Collections.Generic; using System.Globalization; using SciChart.Charting.Model.ChartSeries; using SciChart.Charting.Model.DataSeries; using SciChart.Examples.ExternalDependencies.Common; using SciChart.Examples.ExternalDependencies.Data; namespace SciChart.Examples.Examples.SeeFeaturedApplication.Histogram { public class HistogramViewModel : BaseViewModel { private static readonly double[] BlueSeriesData = {1, 1, 0, 2, 3, 1, 1, 6, 3, 12, 15, 6, 10, 4, 8, 5, 3, 2, 3, 2}; private static readonly double[] RedSeriesData = {0, 0, 1, 2, 3, 1, 2, 6, 9, 9, 10, 6, 5, 13, 4, 8, 8, 4, 3, 4}; private static readonly double[] GreenSeriesData = {1, 2, 4, 4, 5, 8, 7, 10, 10, 6, 8, 6, 11, 3, 7, 4, 1, 0, 0, 1}; public HistogramViewModel() { ChartLabels = new List<HistogramLabelViewModel>(); // StyleKey in RenderableSeriesViewModel must match style resource keys in XAML RenderableSeriesViewModels = new List<IRenderableSeriesViewModel> { GenerateColumn(-2.5, BlueSeriesData, "BlueColumnStyle"), GenerateAvarage(-2.5, BlueSeriesData, "BlueLineStyle"), GenerateColumn(0, RedSeriesData, "RedColumnStyle"), GenerateAvarage(0, BlueSeriesData, "RedLineStyle"), GenerateColumn(2.5, GreenSeriesData, "GreenColumnStyle"), GenerateAvarage(2.5, BlueSeriesData, "GreenLineStyle"), }; } public List<IRenderableSeriesViewModel> RenderableSeriesViewModels { get; set; } public List<HistogramLabelViewModel> ChartLabels { get; set; } private IRenderableSeriesViewModel GenerateColumn(double startsAt, double[] data, string styleKey) { var dataSeries = new XyDataSeries<double, double>(); var xValues = GeneratexValues(startsAt, data.Length); dataSeries.Append(xValues, data); // Annotations for text labels for (var i = 0; i < data.Length; i++) { ChartLabels.Add(new HistogramLabelViewModel(xValues[i], data[i],data[i].ToString(CultureInfo.InvariantCulture))); } return new ColumnRenderableSeriesViewModel { DataSeries = dataSeries, StyleKey = styleKey, }; } private IRenderableSeriesViewModel GenerateAvarage(double startsAt, double[] data, string styleKey) { var dataSeries = new XyDataSeries<double, double>(); var xValues = GeneratexValues(startsAt, data.Length); dataSeries.Append(xValues, data.MovingAverage(3)); return new LineRenderableSeriesViewModel { DataSeries = dataSeries, StyleKey = styleKey, }; } private double[] GeneratexValues(double startsAt, int count) { var xValues = new double[count]; for (var i = 0; i < count; i++) { xValues[i] = startsAt; startsAt += 0.25; } return xValues; } } }
<ResourceDictionary xmlns="http://schemas.microsoft.com/winfx/2006/xaml/presentation" xmlns:x="http://schemas.microsoft.com/winfx/2006/xaml" xmlns:s="http://schemas.abtsoftware.co.uk/scichart"> <Style x:Key="BaseColumnStyle" TargetType="s:FastColumnRenderableSeries"> <Setter Property="Opacity" Value="0.3" /> <Setter Property="StrokeThickness" Value="2" /> <Setter Property="DataPointWidth" Value="0.9" /> </Style> <Style x:Key="BlueColumnStyle" BasedOn="{StaticResource BaseColumnStyle}" TargetType="s:FastColumnRenderableSeries"> <Setter Property="Fill" Value="CornflowerBlue" /> </Style> <Style x:Key="RedColumnStyle" BasedOn="{StaticResource BaseColumnStyle}" TargetType="s:FastColumnRenderableSeries"> <Setter Property="Fill" Value="DarkRed" /> </Style> <Style x:Key="GreenColumnStyle" BasedOn="{StaticResource BaseColumnStyle}" TargetType="s:FastColumnRenderableSeries"> <Setter Property="Fill" Value="ForestGreen" /> </Style> <Style x:Key="BaseLineStyle" TargetType="s:FastLineRenderableSeries"> <Setter Property="StrokeThickness" Value="3" /> </Style> <Style x:Key="BlueLineStyle" BasedOn="{StaticResource BaseLineStyle}" TargetType="s:FastLineRenderableSeries"> <Setter Property="Stroke" Value="CornflowerBlue" /> </Style> <Style x:Key="RedLineStyle" BasedOn="{StaticResource BaseLineStyle}" TargetType="s:FastLineRenderableSeries"> <Setter Property="Stroke" Value="DarkRed" /> </Style> <Style x:Key="GreenLineStyle" BasedOn="{StaticResource BaseLineStyle}" TargetType="s:FastLineRenderableSeries"> <Setter Property="Stroke" Value="ForestGreen" /> </Style> </ResourceDictionary>