SciChart® the market leader in Fast WPF Charts, WPF 3D Charts, iOS Chart, Android Chart and JavaScript Chart Components
SciChart WPF ships with hundreds of WPF Chart Examples which you can browse, play with, view the source-code and even export each WPF Chart Example to a stand-alone Visual Studio solution. All of this is possible with the new and improved SciChart WPF Examples Suite, which ships as part of the SciChart WPF SDK.
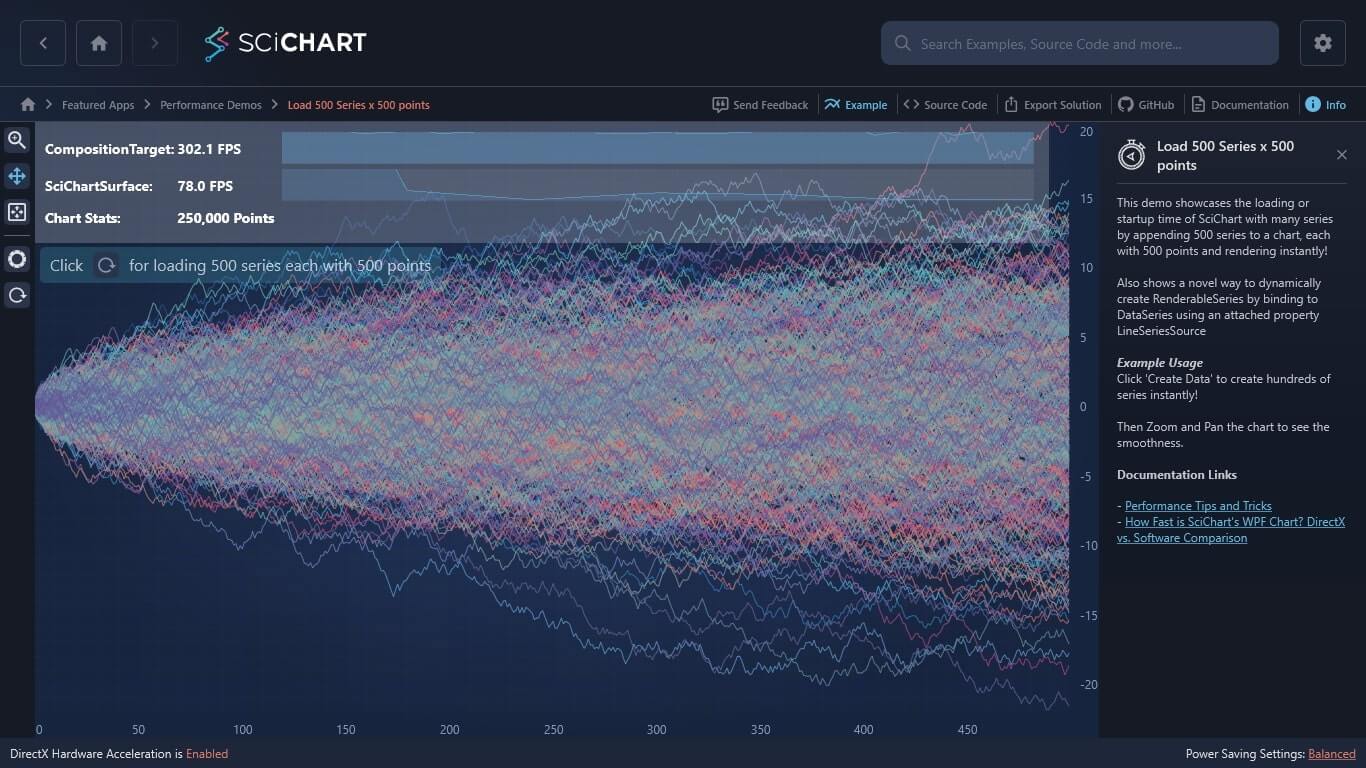
This demo showcases the loading or startup time of SciChart with many series by appending 500 series to a chart, each with 500 points and rendering instantly!
Also shows a novel way to dynamically create RenderableSeries by binding to DataSeries using an attached property LineSeriesSource
Example Usage
Click ‘Create Data’ to create hundreds of series instantly!
Then Zoom and Pan the chart to see the smoothness.
Documentation Links
– Performance Tips and Tricks
– How Fast is SciChart’s WPF Chart? DirectX vs. Software Comparison
The C#/WPF source code for the WPF Chart Load 500 Series x 500 points example is included below (Scroll down!).
Did you know you can also view the source code from one of the following sources as well?
<UserControl x:Class="SciChart.Examples.Examples.PerformanceDemos2D.Load500By500.Load500By500PageView"
xmlns="http://schemas.microsoft.com/winfx/2006/xaml/presentation"
xmlns:x="http://schemas.microsoft.com/winfx/2006/xaml"
xmlns:d="http://schemas.microsoft.com/expression/blend/2008"
xmlns:ext="http://schemas.abtsoftware.co.uk/scichart/exampleExternals"
xmlns:i="http://schemas.microsoft.com/xaml/behaviors"
xmlns:load500By500="clr-namespace:SciChart.Examples.Examples.PerformanceDemos2D.Load500By500"
xmlns:mc="http://schemas.openxmlformats.org/markup-compatibility/2006"
xmlns:s="http://schemas.abtsoftware.co.uk/scichart"
d:DesignHeight="400"
d:DesignWidth="600"
mc:Ignorable="d">
<UserControl.Resources>
<ResourceDictionary>
<ResourceDictionary.MergedDictionaries>
<ResourceDictionary Source="/SciChart.Examples.ExternalDependencies;component/Resources/Styles/ToolbarButtonsCommon.xaml" />
</ResourceDictionary.MergedDictionaries>
</ResourceDictionary>
</UserControl.Resources>
<Grid>
<Grid.ColumnDefinitions>
<ColumnDefinition Width="Auto" />
<ColumnDefinition Width="*" />
</Grid.ColumnDefinitions>
<Grid.RowDefinitions>
<RowDefinition Height="Auto"/>
<RowDefinition/>
</Grid.RowDefinitions>
<ext:SciChartInteractionToolbar Grid.RowSpan="2" x:Name="UserToolbar"
TargetSurface="{Binding Source={x:Reference Name=sciChart}}">
<Button Command="{Binding RunExampleCommand}"
Padding="0"
FontSize="11"
Content="Load"
Style="{StaticResource DefaultButtonStyle}" />
</ext:SciChartInteractionToolbar>
<s:SciChartSurface x:Name="sciChart"
Grid.Column="1"
Grid.RowSpan="2"
ViewportManager="{Binding ViewportManager}"
load500By500:LineSeriesSource.DataSeries="{Binding DataSeries}">
<s:SciChartSurface.XAxis>
<s:NumericAxis />
</s:SciChartSurface.XAxis>
<s:SciChartSurface.YAxis>
<s:NumericAxis />
</s:SciChartSurface.YAxis>
<s:SciChartSurface.ChartModifier>
<s:ModifierGroup>
<s:RubberBandXyZoomModifier IsAnimated="True" />
<s:ZoomPanModifier ExecuteOn="MouseLeftButton" ReceiveHandledEvents="True" />
<s:ZoomExtentsModifier IsAnimated="True" />
<s:XAxisDragModifier />
<s:YAxisDragModifier />
</s:ModifierGroup>
</s:SciChartSurface.ChartModifier>
<!-- Some hints to the user -->
<s:SciChartSurface.Annotations>
<s:CustomAnnotation CoordinateMode="Relative"
HorizontalAnchorPoint="Left"
Margin="10,150,0,0"
VerticalAnchorPoint="Center"
X1="0"
Y1="0" >
<StackPanel Orientation="Horizontal">
<TextBlock FontSize="20"
Opacity="0.7"
Background="#232323"
Text="Click "
Foreground="#FFF" />
<Image Width="32"
Height="32"
Source="/SciChart.Examples;component/Resources/Images/load_button.png"
Stretch="None" />
<TextBlock FontSize="20"
Opacity="0.7"
Background="#232323"
Text=" for loading 500 series each with 500 points!"
Foreground="#FFF" />
</StackPanel>
</s:CustomAnnotation>
</s:SciChartSurface.Annotations>
</s:SciChartSurface>
<s:SciChartPerformanceOverlay Grid.Column="1"
Grid.Row="0"
Margin="0,0,50,0"
VerticalAlignment="Top"
Background="#33FFFFFF"
FontWeight="Bold"
Foreground="#FFF"
Padding="10"
IsHitTestVisible="False"
TargetSurface="{Binding Source={x:Reference Name=sciChart}}" />
</Grid>
</UserControl>
// *************************************************************************************
// SCICHART® Copyright SciChart Ltd. 2011-2022. All rights reserved.
//
// Web: http://www.scichart.com
// Support: support@scichart.com
// Sales: sales@scichart.com
//
// Load500By500PageView.xaml.cs is part of the SCICHART® Examples. Permission is hereby granted
// to modify, create derivative works, distribute and publish any part of this source
// code whether for commercial, private or personal use.
//
// The SCICHART® examples are distributed in the hope that they will be useful, but
// without any warranty. It is provided "AS IS" without warranty of any kind, either
// expressed or implied.
// *************************************************************************************
using System.Windows.Controls;
namespace SciChart.Examples.Examples.PerformanceDemos2D.Load500By500
{
public partial class Load500By500PageView : UserControl
{
public Load500By500PageView()
{
InitializeComponent();
}
}
}
// *************************************************************************************
// SCICHART® Copyright SciChart Ltd. 2011-2022. All rights reserved.
//
// Web: http://www.scichart.com
// Support: support@scichart.com
// Sales: sales@scichart.com
//
// Load500By500PageViewModel.cs is part of the SCICHART® Examples. Permission is hereby granted
// to modify, create derivative works, distribute and publish any part of this source
// code whether for commercial, private or personal use.
//
// The SCICHART® examples are distributed in the hope that they will be useful, but
// without any warranty. It is provided "AS IS" without warranty of any kind, either
// expressed or implied.
// *************************************************************************************
using System;
using System.Collections.Generic;
using System.Diagnostics;
using System.Threading.Tasks;
using SciChart.Charting.Common.Helpers;
using SciChart.Charting.Model.DataSeries;
using SciChart.Charting.ViewportManagers;
using SciChart.Examples.ExternalDependencies.Common;
using SciChart.Examples.ExternalDependencies.Data;
namespace SciChart.Examples.Examples.PerformanceDemos2D.Load500By500
{
public class Load500By500PageViewModel : BaseViewModel
{
private DispatcherObservableCollection<string> _messages;
private int _seriesCount;
private int _pointCount;
private bool _isBusy;
private IEnumerable<IDataSeries> _dataSeries;
public Load500By500PageViewModel()
{
SeriesCount = 500;
PointCount = 500;
Messages = new DispatcherObservableCollection<string>();
RunExampleCommand = new ActionCommand(OnRunExample);
}
private void UpdateExampleTitle()
{
OnPropertyChanged("ExampleTitle");
}
public ActionCommand RunExampleCommand { get; private set; }
public IViewportManager ViewportManager { get; } = new DefaultViewportManager();
public int SeriesCount
{
get => _seriesCount;
set
{
if (_seriesCount != value)
{
_seriesCount = value;
UpdateExampleTitle();
OnPropertyChanged("SeriesCount");
}
}
}
public int PointCount
{
get => _pointCount;
set
{
if (_pointCount != value)
{
_pointCount = value;
UpdateExampleTitle();
OnPropertyChanged("PointCount");
}
}
}
public DispatcherObservableCollection<string> Messages
{
get => _messages;
set
{
if (_messages != value)
{
_messages = value;
OnPropertyChanged("Messages");
}
}
}
public IEnumerable<IDataSeries> DataSeries
{
get => _dataSeries;
set
{
if (_dataSeries != value)
{
_dataSeries = value;
OnPropertyChanged("DataSeries");
}
}
}
public bool IsBusy
{
get => _isBusy;
set
{
if (_isBusy != value)
{
_isBusy = value;
OnPropertyChanged("IsBusy");
}
}
}
public void OnPageExit()
{
DataSeries = null;
}
private void OnRunExample()
{
Task.Factory.StartNew(() =>
{
DataSeries = null;
IsBusy = true;
var stopwatch = Stopwatch.StartNew();
// Generate Data and mark time
var yData = new double[SeriesCount][];
var generator = new RandomWalkGenerator(0d);
for (int i = 0; i < SeriesCount; i++)
{
yData[i] = generator.GetRandomWalkYData(PointCount);
generator.Reset();
}
stopwatch.Stop();
IsBusy = false;
// Append to SciChartSurface and mark time
stopwatch = Stopwatch.StartNew();
var allDataSeries = new IDataSeries[SeriesCount];
for (int i = 0; i < SeriesCount; i++)
{
var dataSeries = new UniformXyDataSeries<double>();
dataSeries.Append(yData[i]);
allDataSeries[i] = dataSeries;
}
DataSeries = allDataSeries;
stopwatch.Stop();
ViewportManager.AnimateZoomExtents(TimeSpan.FromMilliseconds(500));
});
}
}
}
// *************************************************************************************
// SCICHART® Copyright SciChart Ltd. 2011-2022. All rights reserved.
//
// Web: http://www.scichart.com
// Support: support@scichart.com
// Sales: sales@scichart.com
//
// LineSeriesSource.cs is part of the SCICHART® Examples. Permission is hereby granted
// to modify, create derivative works, distribute and publish any part of this source
// code whether for commercial, private or personal use.
//
// The SCICHART® examples are distributed in the hope that they will be useful, but
// without any warranty. It is provided "AS IS" without warranty of any kind, either
// expressed or implied.
// *************************************************************************************
using System;
using System.Collections.Generic;
using System.Collections.ObjectModel;
using System.Windows;
using System.Windows.Media;
using SciChart.Charting.Model.DataSeries;
using SciChart.Charting.Visuals;
using SciChart.Charting.Visuals.RenderableSeries;
namespace SciChart.Examples.Examples.PerformanceDemos2D.Load500By500
{
/// <summary>
/// An Attached Behaviour that creates one FastLineRenderableSeries with random colour for each IDataSeries passed in to the DataSeries property
/// </summary>
public class LineSeriesSource
{
public static readonly DependencyProperty DataSeriesProperty =
DependencyProperty.RegisterAttached("DataSeries", typeof(IEnumerable<IDataSeries>),
typeof(LineSeriesSource),
new PropertyMetadata(default(IEnumerable<IDataSeries>),
OnDataSeriesDependencyPropertyChanged));
public static void SetDataSeries(UIElement element, IEnumerable<IDataSeries> value)
{
element.SetValue(DataSeriesProperty, value);
}
public static IEnumerable<IDataSeries> GetDataSeries(UIElement element)
{
return (IEnumerable<IDataSeries>)element.GetValue(DataSeriesProperty);
}
private static void OnDataSeriesDependencyPropertyChanged(DependencyObject d,
DependencyPropertyChangedEventArgs e)
{
var sciChartSurface = d as SciChartSurface;
if (sciChartSurface == null) return;
if (e.NewValue == null)
{
sciChartSurface.RenderableSeries.Clear();
return;
}
using (sciChartSurface.SuspendUpdates())
{
sciChartSurface.RenderableSeries.Clear();
var random = new Random();
var itr = (IEnumerable<IDataSeries>)e.NewValue;
var renderSeries = new List<IRenderableSeries>();
foreach (var dataSeries in itr)
{
if (dataSeries == null) continue;
var rgb = new byte[3];
random.NextBytes(rgb);
var renderableSeries = new FastLineRenderableSeries()
{
AntiAliasing = true,
Stroke = Color.FromArgb(255, rgb[0], rgb[1], rgb[2]),
DataSeries = dataSeries,
StrokeThickness = 1,
};
renderSeries.Add(renderableSeries);
}
sciChartSurface.RenderableSeries = new ObservableCollection<IRenderableSeries>(renderSeries);
}
}
}
}