SciChart® the market leader in Fast WPF Charts, WPF 3D Charts, iOS Chart, Android Chart and JavaScript Chart Components
SciChart WPF ships with hundreds of WPF Chart Examples which you can browse, play with, view the source-code and even export each WPF Chart Example to a stand-alone Visual Studio solution. All of this is possible with the new and improved SciChart WPF Examples Suite, which ships as part of the SciChart WPF SDK.
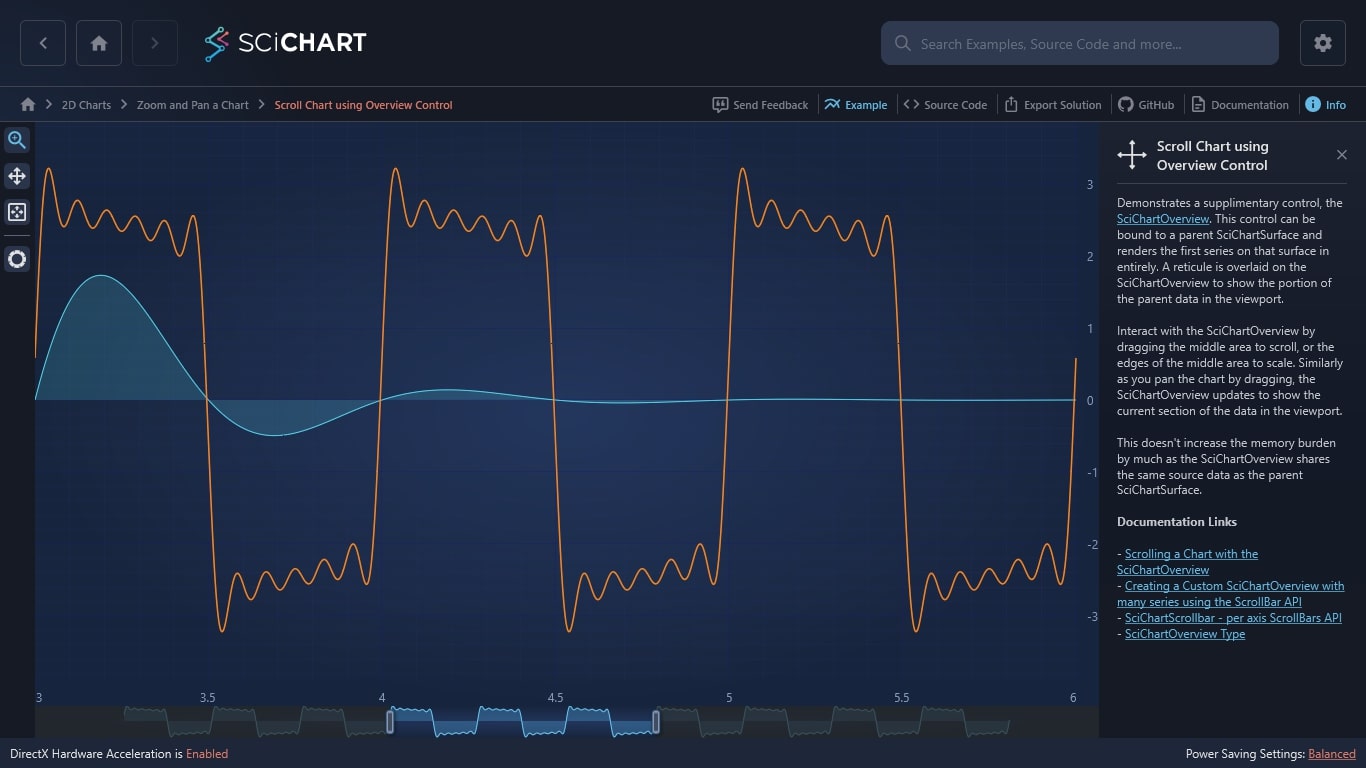
Demonstrates a supplimentary control, the SciChartOverview. This control can be bound to a parent SciChartSurface and renders the first series on that surface in entirely. A reticule is overlaid on the SciChartOverview to show the portion of the parent data in the viewport.
Interact with the SciChartOverview by dragging the middle area to scroll, or the edges of the middle area to scale. Similarly as you pan the chart by dragging, the SciChartOverview updates to show the current section of the data in the viewport.
This doesn’t increase the memory burden by much as the SciChartOverview shares the same source data as the parent SciChartSurface.
Documentation Links
– Scrolling a Chart with the SciChartOverview
– Creating a Custom SciChartOverview with many series using the ScrollBar API
– SciChartScrollbar – per axis ScrollBars API
– SciChartOverview Type
The C#/WPF source code for the Scroll WPF Chart using Overview Control example is included below (Scroll down!).
Did you know you can also view the source code from one of the following sources as well?
<UserControl x:Class="SciChart.Examples.Examples.ZoomAndPanAChart.ScrollChartUsingOverviewControl"
xmlns="http://schemas.microsoft.com/winfx/2006/xaml/presentation"
xmlns:x="http://schemas.microsoft.com/winfx/2006/xaml"
xmlns:s="http://schemas.abtsoftware.co.uk/scichart"
xmlns:mc="http://schemas.openxmlformats.org/markup-compatibility/2006"
xmlns:d="http://schemas.microsoft.com/expression/blend/2008"
xmlns:ext="http://schemas.abtsoftware.co.uk/scichart/exampleExternals"
d:DesignHeight="400"
d:DesignWidth="600"
mc:Ignorable="d">
<Grid>
<Grid.ColumnDefinitions>
<ColumnDefinition Width="Auto" />
<ColumnDefinition Width="*" />
</Grid.ColumnDefinitions>
<Grid.RowDefinitions>
<RowDefinition Height="*" />
<RowDefinition Height="32" />
</Grid.RowDefinitions>
<!-- The SciChartInteractionToolbar adds zoom, pan, zoom extents and rotate functionality -->
<!-- to the chart and is included for example purposes. -->
<!-- If you wish to know how to zoom and pan a chart then do a search for Zoom Pan in the Examples suite! -->
<ext:SciChartInteractionToolbar TargetSurface="{Binding Source={x:Reference Name=sciChart}}" Grid.RowSpan="2"/>
<!-- Declare the SciChartSurface -->
<s:SciChartSurface x:Name="sciChart"
Grid.Column="1">
<s:SciChartSurface.RenderableSeries>
<s:FastMountainRenderableSeries x:Name="mountainSeries"
Fill="#771964FF"
Stroke="#FF0944CF"/>
<s:FastLineRenderableSeries x:Name="lineSeries"
Stroke="#FF279B27"
StrokeThickness="2"/>
</s:SciChartSurface.RenderableSeries>
<s:SciChartSurface.XAxis>
<s:NumericAxis GrowBy="0.1, 0.1" />
</s:SciChartSurface.XAxis>
<s:SciChartSurface.YAxis>
<s:NumericAxis AxisAlignment="Right" GrowBy="0.1, 0.1" />
</s:SciChartSurface.YAxis>
</s:SciChartSurface>
<!-- Declare the SciChartOverview and bind to the main chart -->
<s:SciChartOverview Grid.Row="1" Grid.Column="1"
DataSeries="{Binding Source={x:Reference Name=sciChart}, Path=RenderableSeries[1].DataSeries}"
ParentSurface="{Binding Source={x:Reference Name=sciChart}}"
SelectedRange="{Binding Source={x:Reference Name=sciChart}, Path=XAxis.VisibleRange, Mode=TwoWay}"/>
</Grid>
</UserControl>
// *************************************************************************************
// SCICHART® Copyright SciChart Ltd. 2011-2022. All rights reserved.
//
// Web: http://www.scichart.com
// Support: support@scichart.com
// Sales: sales@scichart.com
//
// ScrollChartUsingOverviewControl.xaml.cs is part of the SCICHART® Examples. Permission is hereby granted
// to modify, create derivative works, distribute and publish any part of this source
// code whether for commercial, private or personal use.
//
// The SCICHART® examples are distributed in the hope that they will be useful, but
// without any warranty. It is provided "AS IS" without warranty of any kind, either
// expressed or implied.
// *************************************************************************************
using System.Windows;
using System.Windows.Controls;
using SciChart.Charting.Model.DataSeries;
using SciChart.Data.Model;
using SciChart.Examples.ExternalDependencies.Data;
namespace SciChart.Examples.Examples.ZoomAndPanAChart
{
/// <summary>
/// Interaction logic for ScrollChartUsingOverviewControl.xaml
/// </summary>
public partial class ScrollChartUsingOverviewControl : UserControl
{
public ScrollChartUsingOverviewControl()
{
InitializeComponent();
this.Loaded += ScrollChartUsingOverviewControl_Loaded;
}
private void ScrollChartUsingOverviewControl_Loaded(object sender, RoutedEventArgs e)
{
// Performing multiple updates in a SuspendUpdates block is efficient as only one redraw is performed
using (sciChart.SuspendUpdates())
{
// Create some DataSeries of type X=double, Y=double
var dataSeries0 = new XyDataSeries<double, double>();
var dataSeries1 = new XyDataSeries<double, double>();
var data2 = DataManager.Instance.GetFourierSeries(1.0, 0.1);
var data1 = DataManager.Instance.GetDampedSinewave(1500, 3.0, 0.0, 0.005, data2.Count);
// Append data to series.
dataSeries0.Append(data1.XData, data1.YData);
dataSeries1.Append(data2.XData, data2.YData);
mountainSeries.DataSeries = dataSeries0;
lineSeries.DataSeries = dataSeries1;
// Set initial zoom
sciChart.XAxis.VisibleRange = new DoubleRange(3, 6);
sciChart.ZoomExtentsY();
}
}
}
}