WPF Chart - Examples
SciChart WPF ships with hundreds of WPF Chart Examples which you can browse, play with, view the source-code and even export each WPF Chart Example to a stand-alone Visual Studio solution. All of this is possible with the new and improved SciChart WPF Examples Suite, which ships as part of the SciChart WPF SDK.
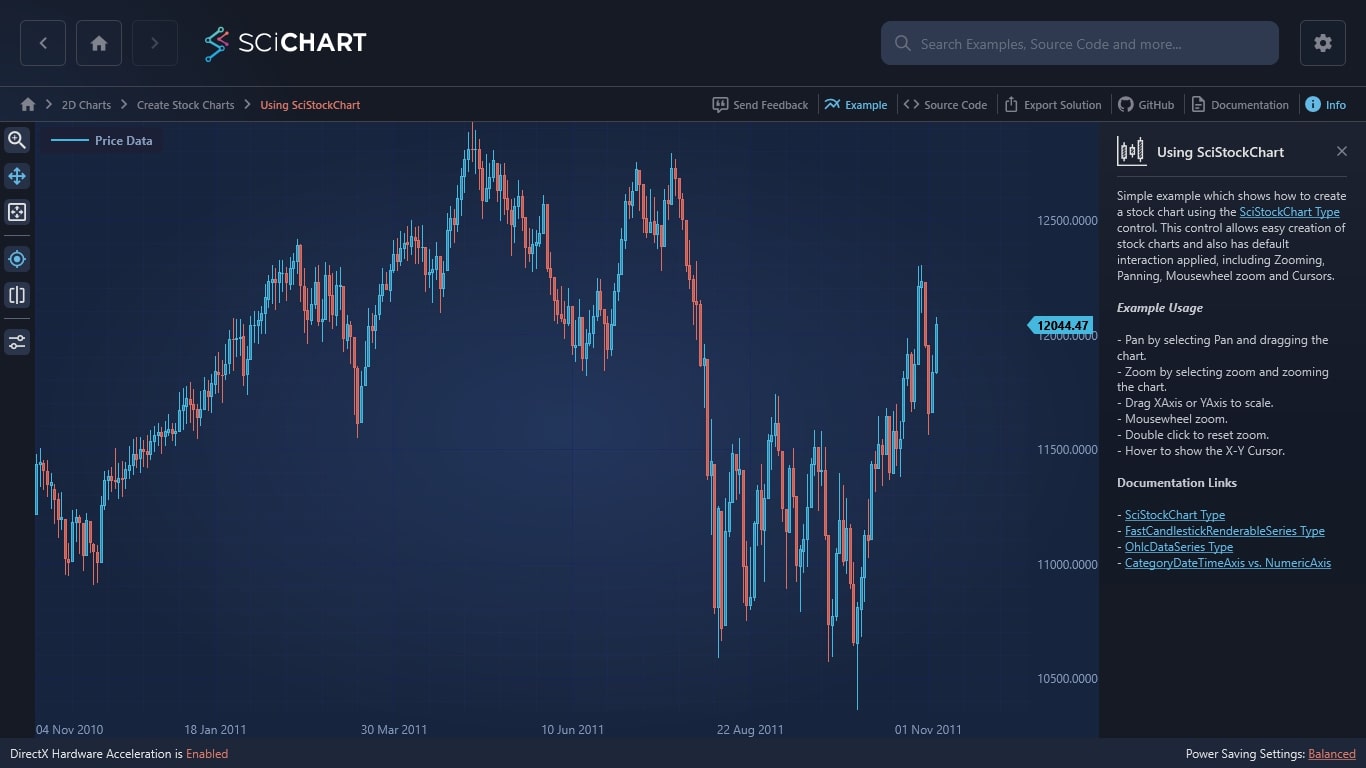
Simple example which shows how to create a stock chart using the SciStockChart Type control. This control allows easy creation of stock charts and also has default interaction applied, including Zooming, Panning, Mousewheel zoom and Cursors.
Example Usage
– Pan by selecting Pan and dragging the chart.
– Zoom by selecting zoom and zooming the chart.
– Drag XAxis or YAxis to scale.
– Mousewheel zoom.
– Double click to reset zoom.
– Hover to show the X-Y Cursor.
Documentation Links
– SciStockChart Type
– FastCandlestickRenderableSeries Type
– OhlcDataSeries Type
– CategoryDateTimeAxis vs. NumericAxis

The C#/WPF source code for the WPF Stock Chart Control example is included below (Scroll down!).
Did you know you can also view the source code from one of the following sources as well?
- Clone the SciChart.WPF.Examples from Github.
- Or, view source in the SciChart WPF Examples suite.
- Also the SciChart WPF Trial contains the full source for the examples (link below).
