SciChart® the market leader in Fast WPF Charts, WPF 3D Charts, and iOS Chart & Android Chart Components
SciChart WPF ships with hundreds of WPF Chart Examples which you can browse, play with, view the source-code and even export each WPF Chart Example to a stand-alone Visual Studio solution. All of this is possible with the new and improved SciChart WPF Examples Suite, which ships as part of the SciChart WPF SDK.
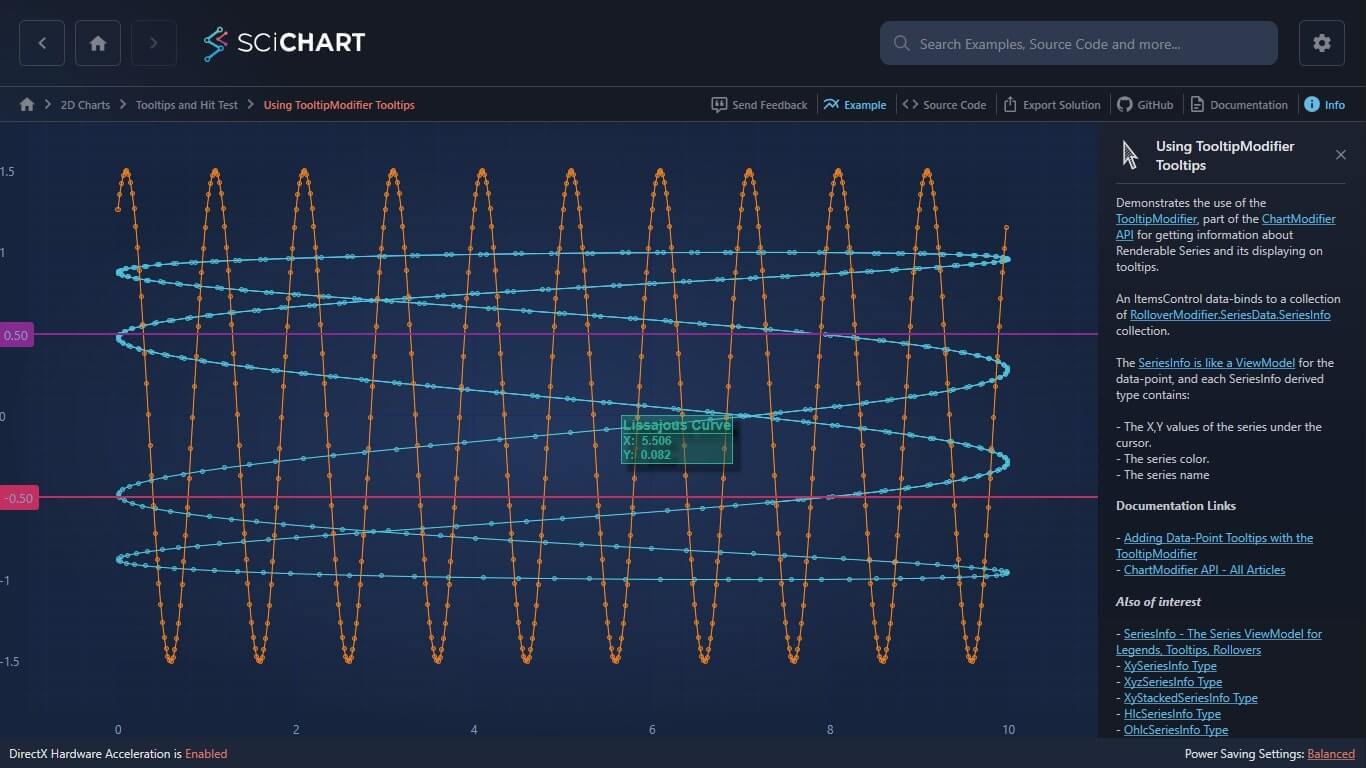
Demonstrates the use of the TooltipModifier, part of the ChartModifier API for getting information about Renderable Series and its displaying on tooltips.
An ItemsControl data-binds to a collection of RolloverModifier.SeriesData.SeriesInfo collection.
The SeriesInfo is like a ViewModel for the data-point, and each SeriesInfo derived type contains the X,Y values of the series under the cursor, the series color and the series name
Documentation Links
The C#/WPF source code for the WPF Chart Using TooltipModifier Tooltips example is included below (Scroll down!).
Did you know you can also view the source code from one of the following sources as well?
<UserControl x:Class="SciChart.Examples.Examples.InspectDatapoints.SeriesTooltipsExample" xmlns="http://schemas.microsoft.com/winfx/2006/xaml/presentation" xmlns:x="http://schemas.microsoft.com/winfx/2006/xaml" xmlns:d="http://schemas.microsoft.com/expression/blend/2008" xmlns:local="clr-namespace:SciChart.Examples.Examples.InspectDatapoints" xmlns:mc="http://schemas.openxmlformats.org/markup-compatibility/2006" xmlns:s="http://schemas.abtsoftware.co.uk/scichart" d:DesignHeight="400" d:DesignWidth="600" mc:Ignorable="d"> <UserControl.Resources> <local:SeriesTooltipsViewModel x:Key="SeriesTooltipsViewModel" /> <s:BooleanToVisibilityConverter x:Key="BooleanToVisibilityConverter" /> <Style TargetType="s:FastLineRenderableSeries"> <Setter Property="SelectedSeriesStyle"> <Setter.Value> <Style TargetType="s:FastLineRenderableSeries"> <Setter Property="PointMarkerTemplate"> <Setter.Value> <ControlTemplate> <s:EllipsePointMarker Width="7" Height="7" Fill="#555" Stroke="#555" StrokeThickness="1" /> </ControlTemplate> </Setter.Value> </Setter> </Style> </Setter.Value> </Setter> </Style> <local:ThresholdBackgroundConverter x:Key="ThresholdForegroundConverter" DefaultBrush="Yellow" HighThresholdBrush="#00AA00" LowThresholdBrush="Red"/> <DataTemplate x:Key="TooltipItemTemplate" DataType="local:TooltipViewModel"> <Grid> <StackPanel Orientation="Vertical" Margin="2"> <TextBlock FontSize="14" FontWeight="Bold" Foreground="{Binding Path=., Converter={StaticResource ThresholdForegroundConverter}}" Text="{Binding Title}" /> <Border Height="1" HorizontalAlignment="Stretch" VerticalAlignment="Center" Background="{Binding Path=., Converter={StaticResource ThresholdForegroundConverter}}" /> <TextBlock FontSize="12" Foreground="{Binding Path=., Converter={StaticResource ThresholdForegroundConverter}}"> <Run FontWeight="Bold" Text="X: " /> <Run Text="{Binding XValue, StringFormat=\{0:0.000\}}" /> </TextBlock> <TextBlock FontSize="12" Foreground="{Binding Path=., Converter={StaticResource ThresholdForegroundConverter}}"> <Run FontWeight="Bold" Text="Y: " /> <Run Text="{Binding YValue, StringFormat=\{0:0.000\}}" /> </TextBlock> <TextBlock FontWeight="Bold" Foreground="{Binding Path=., Converter={StaticResource ThresholdForegroundConverter}}" Text="OVER THRESHOLD" Visibility="{Binding OverThreshold, Converter={StaticResource BooleanToVisibilityConverter}}" /> <TextBlock FontWeight="Bold" Foreground="{Binding Path=., Converter={StaticResource ThresholdForegroundConverter}}" Text="UNDER THRESHOLD" Visibility="{Binding UnderThreshold, Converter={StaticResource BooleanToVisibilityConverter}}" /> </StackPanel> <Rectangle Fill="{Binding Path=., Converter={StaticResource ThresholdForegroundConverter}, ConverterParameter=0.3}" Stroke="{Binding Path=., Converter={StaticResource ThresholdForegroundConverter}}" StrokeThickness="1"/> </Grid> </DataTemplate> </UserControl.Resources> <Grid> <s:SciChartSurface DataContext="{StaticResource SeriesTooltipsViewModel}" s:ThemeManager.Theme="SciChartv4Dark"> <s:SciChartSurface.RenderableSeries> <s:FastLineRenderableSeries DataSeries="{Binding DataSeries1}" Stroke="SteelBlue" s:TooltipModifier.TooltipTemplate="{StaticResource TooltipItemTemplate}"> <s:FastLineRenderableSeries.PointMarkerTemplate> <ControlTemplate> <s:EllipsePointMarker Width="5" Height="5" Fill="SteelBlue" /> </ControlTemplate> </s:FastLineRenderableSeries.PointMarkerTemplate> </s:FastLineRenderableSeries> <s:FastLineRenderableSeries DataSeries="{Binding DataSeries2}" Stroke="#FF3333" s:TooltipModifier.TooltipTemplate="{StaticResource TooltipItemTemplate}"> <s:FastLineRenderableSeries.PointMarkerTemplate> <ControlTemplate> <s:EllipsePointMarker Width="5" Height="5" Fill="#FF3333" /> </ControlTemplate> </s:FastLineRenderableSeries.PointMarkerTemplate> </s:FastLineRenderableSeries> </s:SciChartSurface.RenderableSeries> <s:SciChartSurface.XAxis> <s:NumericAxis GrowBy="0.1, 0.1" /> </s:SciChartSurface.XAxis> <s:SciChartSurface.YAxis> <s:NumericAxis AxisAlignment="Left" GrowBy="0.1, 0.1" /> </s:SciChartSurface.YAxis> <s:SciChartSurface.Annotations> <s:HorizontalLineAnnotation HorizontalAlignment="Stretch" FontSize="13" IsEditable="True" LabelPlacement="Axis" LabelTextFormatting="0.00" ShowLabel="True" Stroke="{Binding HighThresholdBrush, Source={StaticResource ThresholdForegroundConverter}}" StrokeThickness="2" Y1="{Binding HighThreshold, Mode=TwoWay}" /> <s:HorizontalLineAnnotation HorizontalAlignment="Stretch" FontSize="13" IsEditable="True" LabelPlacement="Axis" LabelTextFormatting="0.00" ShowLabel="True" Stroke="{Binding LowThresholdBrush, Source={StaticResource ThresholdForegroundConverter}}" StrokeThickness="2" Y1="{Binding LowThreshold, Mode=TwoWay}" /> </s:SciChartSurface.Annotations> <s:SciChartSurface.ChartModifier> <s:ModifierGroup> <s:RubberBandXyZoomModifier /> <s:ZoomExtentsModifier /> <s:TooltipModifier ReceiveHandledEvents="True" ShowTooltipOn="Always" TooltipLabelDataContextSelector="{Binding TooltipDataContext}" UseInterpolation="True" /> </s:ModifierGroup> </s:SciChartSurface.ChartModifier> </s:SciChartSurface> </Grid> </UserControl>
// ************************************************************************************* // SCICHART® Copyright SciChart Ltd. 2011-2018. All rights reserved. // // Web: http://www.scichart.com // Support: support@scichart.com // Sales: sales@scichart.com // // SeriesTooltipsExample.xaml.cs is part of the SCICHART® Examples. Permission is hereby granted // to modify, create derivative works, distribute and publish any part of this source // code whether for commercial, private or personal use. // // The SCICHART® examples are distributed in the hope that they will be useful, but // without any warranty. It is provided "AS IS" without warranty of any kind, either // expressed or implied. // ************************************************************************************* using System.Windows.Controls; namespace SciChart.Examples.Examples.InspectDatapoints { /// <summary> /// Interaction logic for SeriesTooltipsExample.xaml /// </summary> public partial class SeriesTooltipsExample : UserControl { public SeriesTooltipsExample() { InitializeComponent(); } } }
// ************************************************************************************* // SCICHART® Copyright SciChart Ltd. 2011-2018. All rights reserved. // // Web: http://www.scichart.com // Support: support@scichart.com // Sales: sales@scichart.com // // SeriesTooltipsViewModel.cs is part of the SCICHART® Examples. Permission is hereby granted // to modify, create derivative works, distribute and publish any part of this source // code whether for commercial, private or personal use. // // The SCICHART® examples are distributed in the hope that they will be useful, but // without any warranty. It is provided "AS IS" without warranty of any kind, either // expressed or implied. // ************************************************************************************* using System; using System.Linq; using System.Windows.Media; using SciChart.Charting.Model.ChartData; using SciChart.Charting.Model.DataSeries; using SciChart.Examples.ExternalDependencies.Common; using SciChart.Examples.ExternalDependencies.Data; namespace SciChart.Examples.Examples.InspectDatapoints { public class SeriesTooltipsViewModel : BaseViewModel { private IXyDataSeries<double, double> _dataSeries1; private IXyDataSeries<double, double> _dataSeries2; private double _highThreshold; private double _lowThreshold; public SeriesTooltipsViewModel() { DataSeries1 = new XyDataSeries<double, double> {SeriesName = "Lissajous Curve", AcceptsUnsortedData = true}; var data1 = DataManager.Instance.GetLissajousCurve(0.8, 0.2, 0.43, 500); // just scale the data in X a bit so it matches sinewave data. This is purely for the demo purposes DataSeries1.Append(data1.XData.Select(x => (x + 1.0) * 5.0), data1.YData); DataSeries2 = new XyDataSeries<double, double> { SeriesName = "Sinewave" }; var data2 = DataManager.Instance.GetSinewave(1.5, 1.0, 500); DataSeries2.Append(data2.XData, data2.YData); LowThreshold = -0.5d; HighThreshold = 0.5d; } public IXyDataSeries<double, double> DataSeries2 { get { return _dataSeries2; } set { if (_dataSeries2 == value) return; _dataSeries2 = value; OnPropertyChanged("DataSeries2"); } } public IXyDataSeries<double, double> DataSeries1 { get { return _dataSeries1; } set { if (_dataSeries1 == value) return; _dataSeries1 = value; OnPropertyChanged("DataSeries1"); } } public double HighThreshold { get { return _highThreshold; } set { if (_highThreshold == value) return; _highThreshold = value; OnPropertyChanged("HighThreshold"); } } public double LowThreshold { get { return _lowThreshold; } set { if (_lowThreshold == value) return; _lowThreshold = value; OnPropertyChanged("LowThreshold"); } } public Func<SeriesInfo, object> TooltipDataContext { get { return seriesInfo => { // Create and return a ToolTipViewModel for the tooltip var vm = new TooltipViewModel { XValue = Convert.ToDouble(seriesInfo.XValue), YValue = Convert.ToDouble(seriesInfo.YValue), HighThreshold = this.HighThreshold, LowThreshold = this.LowThreshold, Title = seriesInfo.RenderableSeries.DataSeries.SeriesName, Stroke = seriesInfo.Stroke, // Fill is not used, but we include it to prevent a Binding error from the // overridden TooltipViewModel to the default TooltipModifier.TooltipContainerStyle which // expects a property of type Brush called Fill Fill = Brushes.Transparent, }; vm.OverThreshold = vm.YValue > HighThreshold; vm.UnderThreshold = vm.YValue < LowThreshold; return vm; }; } } } // Here we create a ViewModel for our ToolTip label. // We assume you are using your own ViewModelBase public class TooltipViewModel : BaseViewModel { public double HighThreshold { get; set; } public double LowThreshold { get; set; } public double XValue { get; set;} public double YValue { get; set; } public string Title { get; set; } public string ThresholdText { get; set; } public bool OverThreshold { get; set; } public bool UnderThreshold { get; set; } public bool OverOrUnderThreshold { get { return OverThreshold | UnderThreshold; }} public Color BackgroundColor { get; set; } public Color Stroke { get; set; } public Brush Fill { get; set; } } }
// ************************************************************************************* // SCICHART® Copyright SciChart Ltd. 2011-2018. All rights reserved. // // Web: http://www.scichart.com // Support: support@scichart.com // Sales: sales@scichart.com // // ThresholdBackgroundConverter.cs is part of the SCICHART® Examples. Permission is hereby granted // to modify, create derivative works, distribute and publish any part of this source // code whether for commercial, private or personal use. // // The SCICHART® examples are distributed in the hope that they will be useful, but // without any warranty. It is provided "AS IS" without warranty of any kind, either // expressed or implied. // ************************************************************************************* using System; using System.Globalization; using System.Windows.Data; using System.Windows.Media; namespace SciChart.Examples.Examples.InspectDatapoints { public class ThresholdBackgroundConverter : IValueConverter { public SolidColorBrush DefaultBrush { get; set; } public SolidColorBrush HighThresholdBrush { get; set; } public SolidColorBrush LowThresholdBrush { get; set; } public object Convert(object value, Type targetType, object parameter, CultureInfo culture) { var vm = value as TooltipViewModel; if (vm == null) return null; var brush = DefaultBrush; if (vm.YValue > vm.HighThreshold) brush = HighThresholdBrush; if (vm.YValue < vm.LowThreshold) brush = LowThresholdBrush; var opacityStr = parameter as String; if (opacityStr != null) { double opacity; Double.TryParse(opacityStr, NumberStyles.Number, CultureInfo.InvariantCulture, out opacity); brush = brush.Clone(); brush.Opacity = opacity; } return brush; } public object ConvertBack(object value, Type targetType, object parameter, CultureInfo culture) { throw new NotImplementedException(); } } }