SciChart® the market leader in Fast WPF Charts, WPF 3D Charts, iOS Chart, Android Chart and JavaScript Chart Components
SciChart WPF ships with hundreds of WPF Chart Examples which you can browse, play with, view the source-code and even export each WPF Chart Example to a stand-alone Visual Studio solution. All of this is possible with the new and improved SciChart WPF Examples Suite, which ships as part of the SciChart WPF SDK.
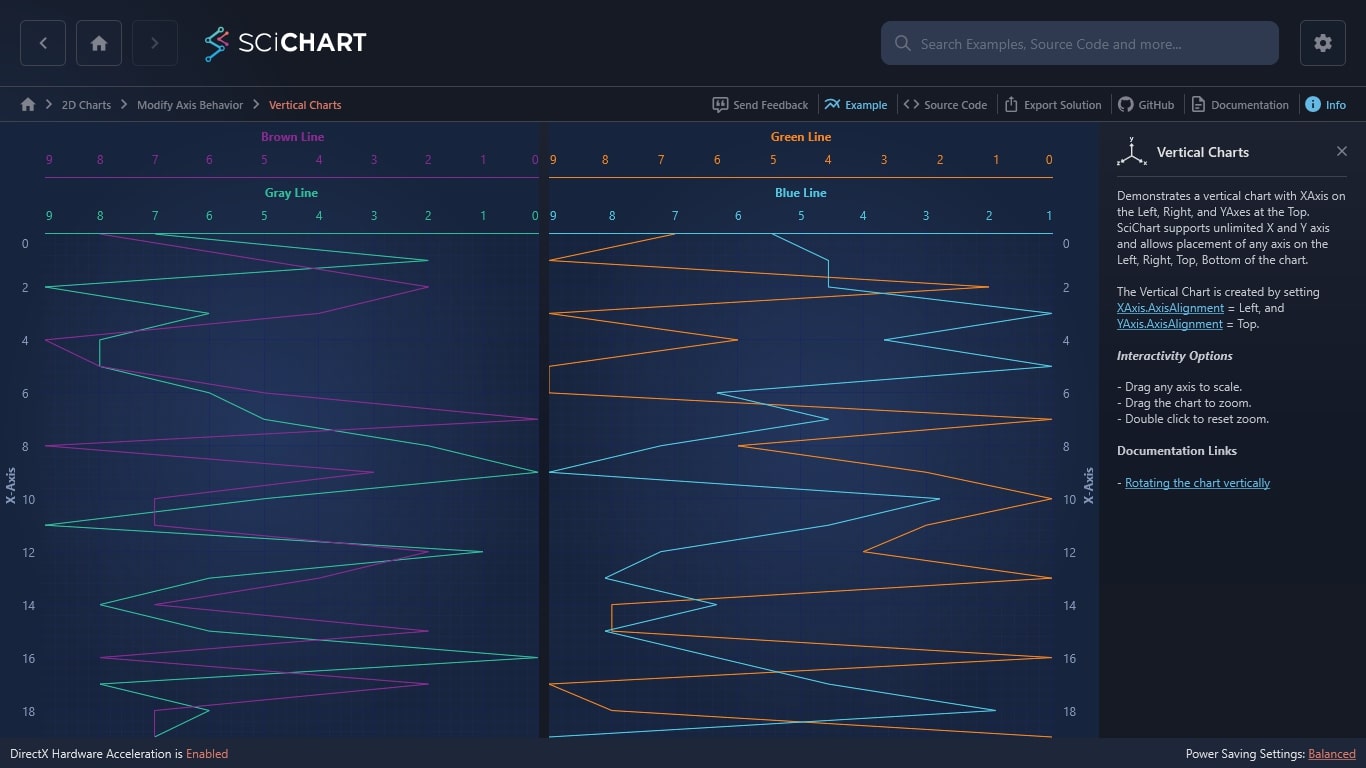
Demonstrates a vertical chart with XAxis on the Left, Right, and YAxes at the Top. SciChart supports unlimited X and Y axis and allows placement of any axis on the Left, Right, Top, Bottom of the chart.
The Vertical Chart is created by setting XAxis.AxisAlignment = Left, and YAxis.AxisAlignment = Top.
Interactivity Options
– Drag any axis to scale.
– Drag the chart to zoom.
– Double click to reset zoom.
Documentation Links
The C#/WPF source code for the WPF Vertical Charts example is included below (Scroll down!).
Did you know you can also view the source code from one of the following sources as well?
<UserControl x:Class="SciChart.Examples.Examples.ModifyAxisBehaviour.VerticalCharts"
xmlns="http://schemas.microsoft.com/winfx/2006/xaml/presentation"
xmlns:x="http://schemas.microsoft.com/winfx/2006/xaml"
xmlns:d="http://schemas.microsoft.com/expression/blend/2008"
xmlns:mc="http://schemas.openxmlformats.org/markup-compatibility/2006"
xmlns:s="http://schemas.abtsoftware.co.uk/scichart"
Loaded="VerticalXAxis_OnLoaded"
d:DesignHeight="400"
d:DesignWidth="600"
mc:Ignorable="d">
<Grid>
<Grid.ColumnDefinitions>
<ColumnDefinition />
</Grid.ColumnDefinitions>
<!-- Declare a chart with two YAxis at the top. -->
<!-- The HorizontalChartGroup is used to synchronize axis area sizes and works like the SciChartGroup.VerticalChartGroup property, but for horizontal charts -->
<s:SciChartSurface Name="sciChartLeft"
Grid.Column="0"
Margin="0 0 10 0"
s:HorizontalGroupHelper.HorizontalChartGroup="MyHorizontalGroup">
<s:SciChartSurface.RenderableSeries>
<s:FastLineRenderableSeries Stroke="DarkGray" YAxisId="Top1" />
<s:FastLineRenderableSeries Stroke="Brown" YAxisId="Top2" />
</s:SciChartSurface.RenderableSeries>
<!-- Define the XAxis for this chart on the Left. Optional bands give a cool look and feel for minimal performance impact -->
<s:SciChartSurface.XAxis>
<s:NumericAxis AxisAlignment="Left"
AxisTitle="X-Axis"
DrawMajorBands="True" />
</s:SciChartSurface.XAxis>
<s:SciChartSurface.YAxes>
<s:NumericAxis AxisAlignment="Top"
AxisTitle="Gray Line"
BorderBrush="DarkGray"
BorderThickness="0,0,0,1"
Id="Top1"
TickTextBrush="DarkGray" />
<s:NumericAxis AxisAlignment="Top"
AxisTitle="Brown Line"
BorderBrush="Brown"
BorderThickness="0,0,0,1"
Id="Top2"
TickTextBrush="Brown" />
</s:SciChartSurface.YAxes>
<s:SciChartSurface.ChartModifier>
<s:ModifierGroup s:MouseManager.MouseEventGroup="myCustomGroup">
<s:RubberBandXyZoomModifier IsXAxisOnly="True" ReceiveHandledEvents="True" />
<s:ZoomExtentsModifier />
</s:ModifierGroup>
</s:SciChartSurface.ChartModifier>
</s:SciChartSurface>
<!-- Declare a chart with one YAxis at the top. -->
<!-- The HorizontalChartGroup is used to synchronize axis area sizes and works like the SciChartGroup.VerticalChartGroup property, but for horizontal charts -->
<s:SciChartSurface Name="sciChartRight"
Grid.Column="1"
s:HorizontalGroupHelper.HorizontalChartGroup="MyHorizontalGroup">
<s:SciChartSurface.RenderableSeries>
<s:FastLineRenderableSeries Stroke="Green" YAxisId="Top1" />
<s:FastLineRenderableSeries Stroke="DeepSkyBlue" YAxisId="Top2" />
</s:SciChartSurface.RenderableSeries>
<!-- Define the XAxis for this chart on the Right. Optional bands give a cool look and feel for minimal performance impact -->
<s:SciChartSurface.XAxis>
<s:NumericAxis AxisAlignment="Right"
AxisTitle="X-Axis"
DrawMajorBands="True" />
</s:SciChartSurface.XAxis>
<s:SciChartSurface.YAxes>
<s:NumericAxis AxisAlignment="Top"
AxisTitle="Blue Line"
BorderBrush="DeepSkyBlue"
BorderThickness="0,0,0,1"
Id="Top1"
TickTextBrush="DeepSkyBlue" />
<s:NumericAxis AxisAlignment="Top"
AxisTitle="Green Line"
BorderBrush="Green"
BorderThickness="0,0,0,1"
Id="Top2"
TickTextBrush="Green" />
</s:SciChartSurface.YAxes>
<s:SciChartSurface.ChartModifier>
<s:ModifierGroup s:MouseManager.MouseEventGroup="myCustomGroup">
<s:RubberBandXyZoomModifier IsXAxisOnly="True" ReceiveHandledEvents="True" />
<s:ZoomExtentsModifier />
</s:ModifierGroup>
</s:SciChartSurface.ChartModifier>
</s:SciChartSurface>
</Grid>
</UserControl>
// *************************************************************************************
// SCICHART® Copyright SciChart Ltd. 2011-2022. All rights reserved.
//
// Web: http://www.scichart.com
// Support: support@scichart.com
// Sales: sales@scichart.com
//
// VerticalCharts.xaml.cs is part of the SCICHART® Examples. Permission is hereby granted
// to modify, create derivative works, distribute and publish any part of this source
// code whether for commercial, private or personal use.
//
// The SCICHART® examples are distributed in the hope that they will be useful, but
// without any warranty. It is provided "AS IS" without warranty of any kind, either
// expressed or implied.
// *************************************************************************************
using System;
using System.Windows;
using System.Windows.Controls;
using SciChart.Charting.Model.DataSeries;
namespace SciChart.Examples.Examples.ModifyAxisBehaviour
{
/// <summary>
/// Interaction logic for VerticalCharts.xaml
/// </summary>
public partial class VerticalCharts : UserControl
{
public VerticalCharts()
{
InitializeComponent();
}
private void VerticalXAxis_OnLoaded(object sender, RoutedEventArgs e)
{
var leftDataSeries0 = new UniformXyDataSeries<double>();
var leftDataSeries1 = new UniformXyDataSeries<double>();
var rightDataSeries0 = new UniformXyDataSeries<double>();
var rightDataSeries1 = new UniformXyDataSeries<double>();
var random = new Random(0);
for (int i = 0; i < 20; i++)
{
leftDataSeries0.Append(random.Next(10));
leftDataSeries1.Append(random.Next(10));
rightDataSeries0.Append(random.Next(10));
rightDataSeries1.Append(random.Next(10));
}
sciChartLeft.RenderableSeries[0].DataSeries = leftDataSeries0;
sciChartLeft.RenderableSeries[1].DataSeries = leftDataSeries1;
sciChartRight.RenderableSeries[0].DataSeries = rightDataSeries0;
sciChartRight.RenderableSeries[1].DataSeries = rightDataSeries1;
}
}
}