SciChart® the market leader in Fast WPF Charts, WPF 3D Charts, iOS Chart, Android Chart and JavaScript Chart Components
SciChart WPF ships with hundreds of WPF Chart Examples which you can browse, play with, view the source-code and even export each WPF Chart Example to a stand-alone Visual Studio solution. All of this is possible with the new and improved SciChart WPF Examples Suite, which ships as part of the SciChart WPF SDK.
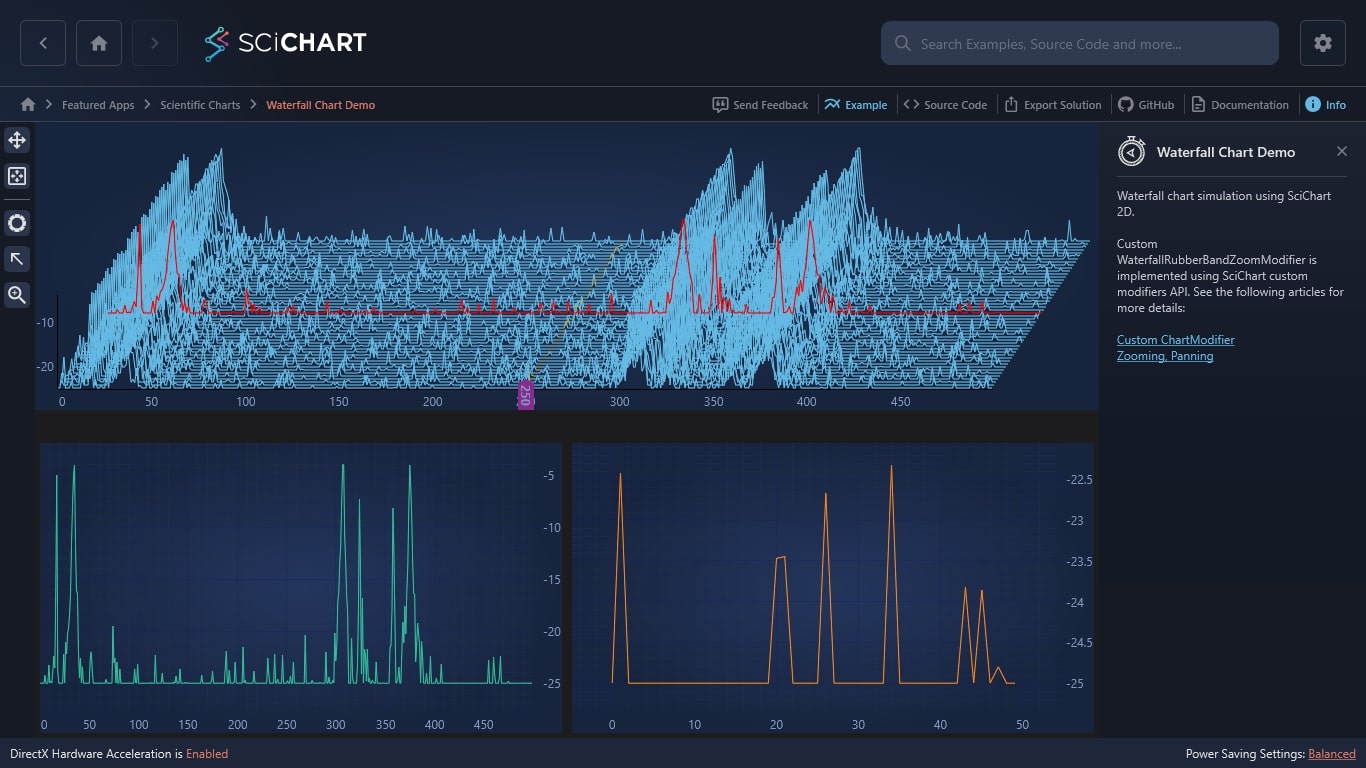
Waterfall chart simulation using SciChart 2D.
Custom WaterfallRubberBandZoomModifier is implemented using SciChart custom modifiers API. See the following articles for more details:
The C#/WPF source code for the WPF Waterfall Chart example is included below (Scroll down!).
Did you know you can also view the source code from one of the following sources as well?
<UserControl x:Class="SciChart.Examples.Examples.SeeFeaturedApplication.WaterfallChart.WaterfallChart"
xmlns="http://schemas.microsoft.com/winfx/2006/xaml/presentation"
xmlns:x="http://schemas.microsoft.com/winfx/2006/xaml"
xmlns:d="http://schemas.microsoft.com/expression/blend/2008"
xmlns:ext="http://schemas.abtsoftware.co.uk/scichart/exampleExternals"
xmlns:mc="http://schemas.openxmlformats.org/markup-compatibility/2006"
xmlns:s="http://schemas.abtsoftware.co.uk/scichart"
xmlns:waterfallChart="clr-namespace:SciChart.Examples.Examples.SeeFeaturedApplication.WaterfallChart"
d:DesignHeight="400"
d:DesignWidth="600"
mc:Ignorable="d">
<UserControl.Resources>
<ResourceDictionary>
<ResourceDictionary.MergedDictionaries>
<ResourceDictionary Source="/SciChart.Examples.ExternalDependencies;component/Resources/Styles/ToolbarButtonsCommon.xaml" />
</ResourceDictionary.MergedDictionaries>
<DataTemplate x:Key="CustomZoomButtonStyle">
<Viewbox>
<Grid Width="26" Height="26">
<Path Data="M 21,13 26,10 26,16 z M 5,13 0,10 0,16 z M 7,0 7,26 M 19,0 19,26 M 9,5 17,1 M 9,8 17,4 M 9,11 17,7 M 9,14 17,10 M 9,17 17,13 M 9,20 17,16 M 9,23 17,19 M 9,26 17,22" Style="{StaticResource ButtonPathStyle}" />
</Grid>
</Viewbox>
</DataTemplate>
<ext:BoolToValueConverter x:Key="BoolToSwitchValueConverter"
FalseValue="True"
TrueValue="False" />
</ResourceDictionary>
</UserControl.Resources>
<Grid Background="#FF1C1C1E">
<Grid.ColumnDefinitions>
<ColumnDefinition Width="Auto" />
<ColumnDefinition Width="*" />
</Grid.ColumnDefinitions>
<Grid.RowDefinitions>
<RowDefinition />
<RowDefinition Height="300" />
</Grid.RowDefinitions>
<!-- The SciChartInteractionToolbar adds zoom, pan, zoom extents and rotate functionality -->
<!-- to the chart and is included for example purposes. -->
<!-- If you wish to know how to zoom and pan a chart then do a search for Zoom Pan in the Examples suite! -->
<ext:SciChartInteractionToolbar Grid.RowSpan="2" TargetSurface="{Binding Source={x:Reference Name=sciChart}}">
<ToggleButton x:Name="customRubberBandButton"
HorizontalAlignment="Left"
Content="Zoom"
ContentTemplate="{StaticResource CustomZoomButtonStyle}"
IsChecked="{Binding Source={x:Reference Name=customRubberBandModifier}, Path=IsEnabled, Mode=TwoWay}"
Style="{StaticResource DefaultToggleButtonStyle}"
ToolTipService.ToolTip="Custom Toggle Rubber-Band Zoom"
s:ToggleButtonExtensions.GroupName="ZoomPanSelectionGroup" />
</ext:SciChartInteractionToolbar>
<s:SciChartSurface x:Name="sciChart"
Grid.Column="1"
Grid.ColumnSpan="2"
Margin="0 0 0 28"
Loaded="SciChart_OnLoaded">
<s:SciChartSurface.ChartModifier>
<s:ModifierGroup>
<s:RubberBandXyZoomModifier ext:SciChartInteractionToolbar.AppearceInToolbar="False" />
<s:AnnotationCreationModifier ext:SciChartInteractionToolbar.AppearceInToolbar="False" />
<s:YAxisDragModifier IsEnabled="False" />
<s:XAxisDragModifier IsEnabled="False" />
<s:ZoomExtentsModifier IsAnimated="True"/>
<s:ZoomPanModifier x:Name="PanModifier"
IsEnabled="False"
XyDirection="XDirection"
ZoomExtentsY="False"/>
<s:SeriesSelectionModifier IsEnabled="False" SelectionChanged="SeriesSelectionModifier_OnSelectionChanged" />
<waterfallChart:CustomWaterfallRubberBandXyZoomModifier x:Name="customRubberBandModifier"
IsAnimated="True"
IsXAxisOnly="True"/>
</s:ModifierGroup>
</s:SciChartSurface.ChartModifier>
<s:SciChartSurface.Annotations>
<s:AxisMarkerAnnotation x:Name="AxisMarkerAnnotation"
AnnotationCanvas="XAxis"
Background="Green"
FormattedValue="{Binding RelativeSource={RelativeSource Self},
Path=AxisInfo.CursorFormattedDataValue}"
IsEditable="True"
MarkerPointWidth="4"
PropertyChanged="AxisMarkerAnnotation_OnPropertyChanged"
VerticalAnchorPoint="Bottom"
X1="250"
XAxisId="AxisX0"
Y1="0"
YAxisId="AxisY0" />
</s:SciChartSurface.Annotations>
</s:SciChartSurface>
<s:SciChartSurface x:Name="sciChart2"
Grid.Row="1"
Grid.Column="1"
Margin="5">
<s:SciChartSurface.RenderableSeries>
<s:FastLineRenderableSeries x:Name="LineRenderableSeries" Stroke="Aqua" />
</s:SciChartSurface.RenderableSeries>
<s:SciChartSurface.XAxis>
<s:NumericAxis x:Name="sciChart2NumericXAxis" VisibleRangeChanged="OnVisibleRangeChanged"/>
</s:SciChartSurface.XAxis>
<s:SciChartSurface.YAxis>
<s:NumericAxis GrowBy="0.1,0.1" />
</s:SciChartSurface.YAxis>
<s:SciChartSurface.ChartModifier>
<s:ModifierGroup>
<s:ZoomExtentsModifier IsAnimated="True"/>
<s:ZoomPanModifier IsEnabled="{Binding Source={x:Reference Name=PanModifier}, Path=IsEnabled,
Mode=OneWay,
UpdateSourceTrigger=PropertyChanged}"
XyDirection="XDirection"
ZoomExtentsY="False"/>
<s:RubberBandXyZoomModifier IsAnimated="True"
IsEnabled="{Binding Source={x:Reference Name=customRubberBandModifier}, Path=IsEnabled,
Mode=OneWay,
UpdateSourceTrigger=PropertyChanged}"
IsXAxisOnly="True"/>
</s:ModifierGroup>
</s:SciChartSurface.ChartModifier>
</s:SciChartSurface>
<s:SciChartSurface x:Name="sciChart3"
Grid.Row="1"
Grid.Column="2"
Margin="5">
<s:SciChartSurface.RenderableSeries>
<s:FastLineRenderableSeries x:Name="LineRenderableSeries2" Stroke="Goldenrod" />
</s:SciChartSurface.RenderableSeries>
<s:SciChartSurface.XAxis>
<s:NumericAxis GrowBy="0.1,0.1" />
</s:SciChartSurface.XAxis>
<s:SciChartSurface.YAxis>
<s:NumericAxis GrowBy="0.1,0.1" />
</s:SciChartSurface.YAxis>
</s:SciChartSurface>
</Grid>
</UserControl>
using System;
using System.Collections.ObjectModel;
using System.ComponentModel;
using System.Linq;
using System.Windows;
using System.Windows.Controls;
using System.Windows.Media;
using SciChart.Charting.Common.Extensions;
using SciChart.Charting.Model.DataSeries;
using SciChart.Charting.Visuals.Axes;
using SciChart.Charting.Visuals.Events;
using SciChart.Charting.Visuals.RenderableSeries;
using SciChart.Core.Extensions;
using SciChart.Examples.ExternalDependencies.Data;
namespace SciChart.Examples.Examples.SeeFeaturedApplication.WaterfallChart
{
/// <summary>
/// Interaction logic for WaterfallChart.xaml
/// </summary>
public partial class WaterfallChart : UserControl
{
// A drop in replacement for System.Random which is 3x faster: https://www.codeproject.com/Articles/9187/A-fast-equivalent-for-System-Random
private readonly Random _random = new Random();
private readonly FFT2 _transform;
private VerticalValuesPaletteProvider _paletteProvider;
private XyDataSeries<double, double> _emptySeries;
public WaterfallChart()
{
InitializeComponent();
_transform = new FFT2();
_transform.init(10);
_paletteProvider = new VerticalValuesPaletteProvider();
}
private void SciChart_OnLoaded(object sender, RoutedEventArgs e)
{
var count = 50;
var renderableSeries = new ObservableCollection<IRenderableSeries>();
sciChart.YAxes.Clear();
sciChart.XAxes.Clear();
for (var i = 0; i < count; i++)
{
var yAxis = new CustomWaterfallNumericAxis();
yAxis.offset = 3.0 * -i;
yAxis.min = -60.0;
yAxis.max = 60;
yAxis.Id = "AxisY" + i;
yAxis.AutoRange = AutoRange.Once;
yAxis.DrawMinorTicks = false;
yAxis.DrawMinorGridLines = false;
yAxis.DrawMajorGridLines = false;
yAxis.DrawMajorBands = false;
yAxis.DrawMajorTicks = false;
yAxis.AxisAlignment = AxisAlignment.Left;
yAxis.BorderBrush = Brushes.Black;
yAxis.BorderThickness = new Thickness(0, 0, 1, 0);
yAxis.Margin = new Thickness(0, sciChart.ActualHeight * 0.6, 0, 0);
var xAxis = new CustomWaterfallNumericAxis();
xAxis.offset = 2.0 * i;
xAxis.max = 10.0;
xAxis.Id = "AxisX" + i;
xAxis.DrawMinorTicks = false;
xAxis.DrawMinorGridLines = false;
xAxis.DrawMajorGridLines = false;
xAxis.DrawMajorBands = false;
xAxis.DrawMajorTicks = false;
xAxis.BorderThickness = new Thickness(0, 1, 0, 0);
xAxis.BorderBrush = Brushes.Black;
xAxis.Margin = new Thickness(0, 0, sciChart.ActualWidth * 0.1, 0);
var series = new FastLineRenderableSeries();
series.YAxisId = yAxis.Id;
series.PaletteProvider = _paletteProvider;
series.XAxisId = xAxis.Id;
series.DataSeries = UpdateXyDataSeries();
series.Stroke = Colors.DarkGreen;
if (i != 0)
{
xAxis.Visibility = Visibility.Hidden;
xAxis.Height = 0.0;
yAxis.Visibility = Visibility.Hidden;
yAxis.Width = 0.0;
}
sciChart.YAxes.Add(yAxis);
sciChart.XAxes.Add(xAxis);
renderableSeries.Add(series);
}
sciChart.RenderableSeries = renderableSeries;
sciChart.RenderableSeries[25].IsSelected = true;
sciChart.XAxes[0].VisibleRangeChanged += OnVisibleRangeChanged;
OnSeriesSelect();
OnAxisMarkerAnnotationMove();
}
private void OnSeriesSelect()
{
var selectedSeries = sciChart.SelectedRenderableSeries.FirstOrDefault();
if (selectedSeries != null)
{
LineRenderableSeries.DataSeries = selectedSeries.DataSeries;
}
else
{
LineRenderableSeries.DataSeries = _emptySeries;
}
}
private void OnAxisMarkerAnnotationMove()
{
var doubleSeries = new XyDataSeries<double, double>();
var axisInfo = AxisMarkerAnnotation.AxisInfo;
var dataIndex = 0;
if (axisInfo != null)
{
var position = (double)axisInfo.DataValue;
dataIndex = sciChart.RenderableSeries[0].DataSeries.XValues.FindIndex(true, position, SearchMode.Nearest);
}
else dataIndex = Convert.ToInt32(AxisMarkerAnnotation.X1);
if (_paletteProvider != null)
{
_paletteProvider.SelectedIndex = dataIndex;
}
for (var i = 0; i < sciChart.RenderableSeries.Count; i++)
{
doubleSeries.Append(i, (double)sciChart.RenderableSeries[i].DataSeries.YValues[dataIndex]);
_paletteProvider.OnBeginSeriesDraw(sciChart.RenderableSeries[i]);
}
if (sciChart3 != null && sciChart3.RenderableSeries.Any())
{
sciChart3.RenderableSeries[0].DataSeries = doubleSeries;
sciChart3.ZoomExtents();
}
}
private XyDataSeries<double, double> UpdateXyDataSeries()
{
var doubleSeries = new XyDataSeries<double, double>();
var _re = new double[1024];
var _im = new double[1024];
for (var i = 0; i < 1024; i++)
{
_re[i] = 2.0 * Math.Sin(2 * Math.PI * i / 20) +
5 * Math.Sin(2 * Math.PI * i / 10) +
2.0 * _random.NextDouble();
_im[i] = -10;
}
_transform.run(_re, _im);
var _re2 = new double[500];
var _im2 = new double[500];
for (var i = 0; i < 500; i++)
{
var mag = Math.Sqrt(_re[i] * _re[i] + _im[i] * _im[i]);
var yVal = 20 * Math.Log10(mag / 500);
_re2[i] = (yVal < -25 || yVal > -5)
? (yVal < -25) ? -25 : _random.Next(-6, -3)
: yVal;
_im2[i] = i;
}
_re2[0] = -25;
doubleSeries.Append(_im2, _re2);
return doubleSeries;
}
private void SeriesSelectionModifier_OnSelectionChanged(object sender, EventArgs e)
{
OnSeriesSelect();
}
private void AxisMarkerAnnotation_OnPropertyChanged(object sender, PropertyChangedEventArgs e)
{
using (sciChart.SuspendUpdates())
{
customRubberBandButton.IsChecked = false;
OnAxisMarkerAnnotationMove();
}
}
private void OnVisibleRangeChanged(object sender, VisibleRangeChangedEventArgs e)
{
if (sender.Equals(sciChart2NumericXAxis))
{
sciChart.XAxes.ForEachDo(x => x.VisibleRange = e.NewVisibleRange);
}
else sciChart2NumericXAxis.VisibleRange = e.NewVisibleRange;
}
}
}
using System;
using SciChart.Charting.Visuals.Axes;
using SciChart.Data.Model;
namespace SciChart.Examples.Examples.SeeFeaturedApplication.WaterfallChart
{
public class CustomWaterfallNumericAxis : NumericAxis
{
public double offset { get; set; }
public double min { get; set; }
public double max { get; set; }
public CustomWaterfallNumericAxis()
{
min = 0.0;
max = 0.0;
}
public override double GetAxisOffset()
{
return base.GetAxisOffset() + offset;
}
protected override IRange CalculateDataRange()
{
return IsXAxis ? new DoubleRange(0.0, 15.0) : new DoubleRange(-50.0, 50.0);
}
public override IRange GetMaximumRange()
{
return (min.Equals(max)) ? new DoubleRange(min, max) : base.GetMaximumRange();
}
}
}
using System;
using System.Windows;
using SciChart.Charting.ChartModifiers;
using SciChart.Core.Utility.Mouse;
namespace SciChart.Examples.Examples.SeeFeaturedApplication.WaterfallChart
{
public class CustomWaterfallRubberBandXyZoomModifier : RubberBandXyZoomModifier
{
public Point startPoint { get; set; }
public Point endPoint { get; set; }
public override void OnModifierMouseDown(ModifierMouseArgs e)
{
base.OnModifierMouseDown(e);
startPoint = GetPointRelativeTo(e.MousePoint, ModifierSurface);
}
public override void OnModifierMouseUp(ModifierMouseArgs e)
{
ModifierSurface.ReleaseMouseCapture();
endPoint = GetPointRelativeTo(e.MousePoint, ModifierSurface);
OnAttached();
if (Math.Abs(startPoint.X - endPoint.X) > 10)
{
int i = 0;
foreach (CustomWaterfallNumericAxis YAxis in ParentSurface.XAxes)
{
YAxis.Zoom(startPoint.X + i * 2, endPoint.X + i * 2, TimeSpan.FromMilliseconds(1000));
i++;
}
}
}
}
}
// *************************************************************************************
// SCICHART® Copyright SciChart Ltd. 2011-2022. All rights reserved.
//
// Web: http://www.scichart.com
// Support: support@scichart.com
// Sales: sales@scichart.com
//
// FFT.cs is part of the SCICHART® Examples. Permission is hereby granted
// to modify, create derivative works, distribute and publish any part of this source
// code whether for commercial, private or personal use.
//
// The SCICHART® examples are distributed in the hope that they will be useful, but
// without any warranty. It is provided "AS IS" without warranty of any kind, either
// expressed or implied.
// *************************************************************************************
using System;
// Reference: http://gerrybeauregard.wordpress.com/2011/04/01/an-fft-in-c/
namespace SciChart.Examples.ExternalDependencies.Data
{
/**
* Performs an in-place complex FFT.
*
* Released under the MIT License
*
* Copyright (c) 2010 Gerald T. Beauregard
*
* Permission is hereby granted, free of charge, to any person obtaining a copy
* of this software and associated documentation files (the "Software"), to
* deal in the Software without restriction, including without limitation the
* rights to use, copy, modify, merge, publish, distribute, sublicense, and/or
* sell copies of the Software, and to permit persons to whom the Software is
* furnished to do so, subject to the following conditions:
*
* The above copyright notice and this permission notice shall be included in
* all copies or substantial portions of the Software.
*
* THE SOFTWARE IS PROVIDED "AS IS", WITHOUT WARRANTY OF ANY KIND, EXPRESS OR
* IMPLIED, INCLUDING BUT NOT LIMITED TO THE WARRANTIES OF MERCHANTABILITY,
* FITNESS FOR A PARTICULAR PURPOSE AND NONINFRINGEMENT. IN NO EVENT SHALL THE
* AUTHORS OR COPYRIGHT HOLDERS BE LIABLE FOR ANY CLAIM, DAMAGES OR OTHER
* LIABILITY, WHETHER IN AN ACTION OF CONTRACT, TORT OR OTHERWISE, ARISING
* FROM, OUT OF OR IN CONNECTION WITH THE SOFTWARE OR THE USE OR OTHER DEALINGS
* IN THE SOFTWARE.
*/
public class FFT2
{
// Element for linked list in which we store the
// input/output data. We use a linked list because
// for sequential access it's faster than array index.
class FFTElement
{
public double re = 0.0; // Real component
public double im = 0.0; // Imaginary component
public FFTElement next; // Next element in linked list
public uint revTgt; // Target position post bit-reversal
}
private uint m_logN = 0; // log2 of FFT size
private uint m_N = 0; // FFT size
private FFTElement[] m_X; // Vector of linked list elements
/**
*
*/
public FFT2()
{
}
/**
* Initialize class to perform FFT of specified size.
*
* @param logN Log2 of FFT length. e.g. for 512 pt FFT, logN = 9.
*/
public void init(
uint logN)
{
m_logN = logN;
m_N = (uint)(1 << (int)m_logN);
// Allocate elements for linked list of complex numbers.
m_X = new FFTElement[m_N];
for (uint k = 0; k < m_N; k++)
m_X[k] = new FFTElement();
// Set up "next" pointers.
for (uint k = 0; k < m_N - 1; k++)
m_X[k].next = m_X[k + 1];
// Specify target for bit reversal re-ordering.
for (uint k = 0; k < m_N; k++)
m_X[k].revTgt = BitReverse(k, logN);
}
/**
* Performs in-place complex FFT.
*
* @param xRe Real part of input/output
* @param xIm Imaginary part of input/output
* @param inverse If true, do an inverse FFT
*/
public void run(
double[] xRe,
double[] xIm,
bool inverse = false)
{
uint numFlies = m_N >> 1; // Number of butterflies per sub-FFT
uint span = m_N >> 1; // Width of the butterfly
uint spacing = m_N; // Distance between start of sub-FFTs
uint wIndexStep = 3; // Increment for twiddle table index
// Copy data into linked complex number objects
// If it's an IFFT, we divide by N while we're at it
FFTElement x = m_X[0];
uint k = 0;
double scale = inverse ? 1.0 / m_N : 1.0;
while (x != null)
{
x.re = scale * xRe[k];
x.im = scale * xIm[k];
x = x.next;
k++;
}
// For each stage of the FFT
for (uint stage = 0; stage < m_logN; stage++)
{
// Compute a multiplier factor for the "twiddle factors".
// The twiddle factors are complex unit vectors spaced at
// regular angular intervals. The angle by which the twiddle
// factor advances depends on the FFT stage. In many FFT
// implementations the twiddle factors are cached, but because
// array lookup is relatively slow in C#, it's just
// as fast to compute them on the fly.
double wAngleInc = wIndexStep * 2.0 * Math.PI / m_N;
if (inverse == false)
wAngleInc *= -1;
double wMulRe = Math.Cos(wAngleInc);
double wMulIm = Math.Sin(wAngleInc);
for (uint start = 0; start < m_N; start += spacing)
{
FFTElement xTop = m_X[start];
FFTElement xBot = m_X[start + span];
double wRe = 1.0;
double wIm = 0.0;
// For each butterfly in this stage
for (uint flyCount = 0; flyCount < numFlies; ++flyCount)
{
// Get the top & bottom values
double xTopRe = xTop.re;
double xTopIm = xTop.im;
double xBotRe = xBot.re;
double xBotIm = xBot.im;
// Top branch of butterfly has addition
xTop.re = xTopRe + xBotRe;
xTop.im = xTopIm + xBotIm;
// Bottom branch of butterly has subtraction,
// followed by multiplication by twiddle factor
xBotRe = xTopRe - xBotRe;
xBotIm = xTopIm - xBotIm;
xBot.re = xBotRe * wRe - xBotIm * wIm;
xBot.im = xBotRe * wIm + xBotIm * wRe;
// Advance butterfly to next top & bottom positions
xTop = xTop.next;
xBot = xBot.next;
// Update the twiddle factor, via complex multiply
// by unit vector with the appropriate angle
// (wRe + j wIm) = (wRe + j wIm) x (wMulRe + j wMulIm)
double tRe = wRe;
wRe = wRe * wMulRe - wIm * wMulIm;
wIm = tRe * wMulIm + wIm * wMulRe;
}
}
numFlies >>= 1; // Divide by 2 by right shift
span >>= 1;
spacing >>= 1;
wIndexStep <<= 1; // Multiply by 2 by left shift
}
// The algorithm leaves the result in a scrambled order.
// Unscramble while copying values from the complex
// linked list elements back to the input/output vectors.
x = m_X[0];
while (x != null)
{
uint target = x.revTgt;
xRe[target] = x.re;
xIm[target] = x.im;
x = x.next;
}
}
/**
* Do bit reversal of specified number of places of an int
* For example, 1101 bit-reversed is 1011
*
* @param x Number to be bit-reverse.
* @param numBits Number of bits in the number.
*/
private uint BitReverse(
uint x,
uint numBits)
{
uint y = 0;
for (uint i = 0; i < numBits; i++)
{
y <<= 1;
y |= x & 0x0001;
x >>= 1;
}
return y;
}
}
}
using SciChart.Charting.Visuals.PaletteProviders;
using System;
using System.Collections.Generic;
using System.Linq;
using System.Text;
using System.Windows;
using System.Windows.Media;
using SciChart.Charting.Model.DataSeries;
using SciChart.Charting.Visuals.RenderableSeries;
namespace SciChart.Examples.Examples.SeeFeaturedApplication.WaterfallChart
{
public class VerticalValuesPaletteProvider : DependencyObject, IStrokePaletteProvider
{
public int SelectedIndex { get; set; }
public Color? OverrideStrokeColor(IRenderableSeries rSeries, int index, IPointMetadata metadata)
{
if (rSeries.IsSelected)
{
return Colors.Aqua;
}
if (index == SelectedIndex)
{
return Colors.Goldenrod;
}
return null;
}
public void OnBeginSeriesDraw(IRenderableSeries rSeries)
{
}
}
}