SciChart® the market leader in Fast WPF Charts, WPF 3D Charts, iOS Chart, Android Chart and JavaScript Chart Components
SciChart WPF ships with hundreds of WPF Chart Examples which you can browse, play with, view the source-code and even export each WPF Chart Example to a stand-alone Visual Studio solution. All of this is possible with the new and improved SciChart WPF Examples Suite, which ships as part of the SciChart WPF SDK.
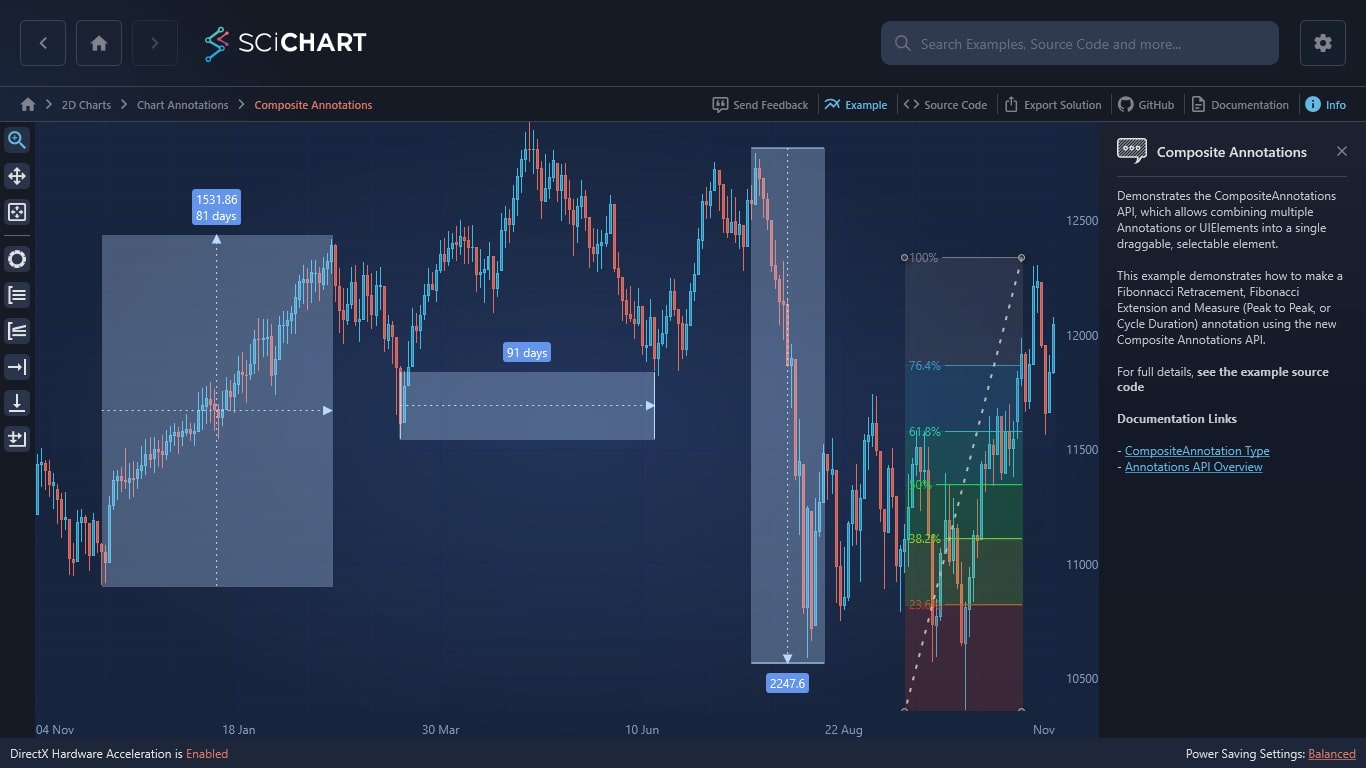
Demonstrates the CompositeAnnotations API, which allows combining multiple Annotations or UIElements into a single draggable, selectable element.
This example demonstrates how to make a Fibonnacci Retracement, Fibonacci Extension and Measure (Peak to Peak, or Cycle Duration) annotation using the new Composite Annotations API.
For full details, see the example source code
Documentation Links
The C#/WPF source code for the WPF Chart Composite Annotations example is included below (Scroll down!).
Did you know you can also view the source code from one of the following sources as well?
<UserControl x:Class="SciChart.Examples.Examples.AnnotateAChart.CompositeAnnotations.CompositeAnnotationsView"
xmlns="http://schemas.microsoft.com/winfx/2006/xaml/presentation"
xmlns:x="http://schemas.microsoft.com/winfx/2006/xaml"
xmlns:d="http://schemas.microsoft.com/expression/blend/2008"
xmlns:ext="http://schemas.abtsoftware.co.uk/scichart/exampleExternals"
xmlns:mc="http://schemas.openxmlformats.org/markup-compatibility/2006"
xmlns:s="http://schemas.abtsoftware.co.uk/scichart"
d:DesignHeight="400"
d:DesignWidth="600"
mc:Ignorable="d">
<UserControl.Resources>
<Style x:Key="PathStyle" TargetType="Path">
<Setter Property="Stroke" Value="{Binding Path=(ext:TextElementEx.Foreground), RelativeSource={RelativeSource FindAncestor, AncestorType=ContentPresenter}}" />
<Setter Property="Fill" Value="{Binding Path=(ext:TextElementEx.Foreground), RelativeSource={RelativeSource FindAncestor, AncestorType=ContentPresenter}}" />
<Setter Property="StrokeThickness" Value="1" />
</Style>
<DataTemplate x:Key="FibonacciRetracementContent">
<Viewbox>
<Grid Width="26" Height="26">
<Path Data="M 1,1 L 25,1 M 1,13 L 25,13 M 1,25 L 25,25" Style="{StaticResource PathStyle}" />
</Grid>
</Viewbox>
</DataTemplate>
<DataTemplate x:Key="FibonacciExtensionContent">
<Viewbox>
<Grid Width="26" Height="26">
<Path Data="M 25,1 L 1,9 L 1,15 L 25,15 M 1,20 L 25,20 M 1,25 L 25,25" Fill="Transparent" Style="{StaticResource PathStyle}" />
</Grid>
</Viewbox>
</DataTemplate>
<DataTemplate x:Key="MeasureXContent">
<Viewbox>
<Grid Width="26" Height="26">
<Path Data="M 24,13 19,10 19,16 z M 0,13 20,13 M 26,8 26,18" Style="{StaticResource PathStyle}" />
</Grid>
</Viewbox>
</DataTemplate>
<DataTemplate x:Key="MeasureYContent">
<Viewbox>
<Grid Width="26" Height="26">
<Path Data="M 13,24 16,19 10,19 z M 13,0 L13,20 M 8,26 18,26" Style="{StaticResource PathStyle}" />
</Grid>
</Viewbox>
</DataTemplate>
<DataTemplate x:Key="MeasureXyContent">
<Viewbox>
<Grid Width="26" Height="26">
<Path Data="M 13,24 16,19 10,19 z M 24,13 19,10 19,16 z M 13,0 L13,20 M 0,13 20,13 M 26,8 26,18 M 8,26 18,26" Style="{StaticResource PathStyle}" />
</Grid>
</Viewbox>
</DataTemplate>
</UserControl.Resources>
<Grid>
<Grid.ColumnDefinitions>
<ColumnDefinition Width="Auto" />
<ColumnDefinition Width="*" />
</Grid.ColumnDefinitions>
<!-- The SciChartInteractionToolbar adds zoom, pan, zoom extents and rotate functionality -->
<!-- to the chart and is included for example purposes. -->
<!-- If you wish to know how to zoom and pan a chart then do a search for Zoom Pan in the Examples suite! -->
<ext:SciChartInteractionToolbar TargetSurface="{Binding Source={x:Reference Name=SciChart}}">
<ToggleButton x:Name="FibRetr"
Margin="3"
HorizontalAlignment="Left"
Checked="FibonacciRetracementChecked"
ContentTemplate="{StaticResource FibonacciRetracementContent}"
Style="{StaticResource DefaultToggleButtonStyle}"
ToolTipService.ToolTip="Create Fibonacci Retracement Annotation"
Unchecked="AnnotationTypeUnchecked"
s:ToggleButtonExtensions.GroupName="ZoomPanSelectionGroup" />
<ToggleButton x:Name="FibExt"
Margin="3"
HorizontalAlignment="Left"
Checked="FibonacciExtensionChecked"
ContentTemplate="{StaticResource FibonacciExtensionContent}"
Style="{StaticResource DefaultToggleButtonStyle}"
ToolTipService.ToolTip="Create Fibonacci Extension Annotation"
Unchecked="AnnotationTypeUnchecked"
s:ToggleButtonExtensions.GroupName="ZoomPanSelectionGroup" />
<ToggleButton x:Name="MeasureX"
Margin="3"
HorizontalAlignment="Left"
Checked="MeasureXChecked"
ContentTemplate="{StaticResource MeasureXContent}"
Style="{StaticResource DefaultToggleButtonStyle}"
ToolTipService.ToolTip="Create MeasureXAnnotation"
Unchecked="AnnotationTypeUnchecked"
s:ToggleButtonExtensions.GroupName="ZoomPanSelectionGroup" />
<ToggleButton x:Name="MeasureY"
Margin="3"
HorizontalAlignment="Left"
Checked="MeasureYChecked"
ContentTemplate="{StaticResource MeasureYContent}"
Style="{StaticResource DefaultToggleButtonStyle}"
ToolTipService.ToolTip="Create MeasureYAnnotation"
Unchecked="AnnotationTypeUnchecked"
s:ToggleButtonExtensions.GroupName="ZoomPanSelectionGroup" />
<ToggleButton x:Name="MeasureXy"
Margin="3"
HorizontalAlignment="Left"
Checked="MeasureXyChecked"
ContentTemplate="{StaticResource MeasureXyContent}"
Style="{StaticResource DefaultToggleButtonStyle}"
ToolTipService.ToolTip="Create MeasureXYAnnotation"
Unchecked="AnnotationTypeUnchecked"
s:ToggleButtonExtensions.GroupName="ZoomPanSelectionGroup" />
</ext:SciChartInteractionToolbar>
<s:SciChartSurface x:Name="SciChart"
Grid.Column="1"
RenderableSeries="{s:SeriesBinding RenderableSeriesViewModels}">
<!-- Styles.xaml resource keys must match StyleKey in RenderableSeriesViewModel -->
<s:SciChartSurface.Resources>
<!-- <ResourceDictionary Source="Styles.xaml" /> -->
</s:SciChartSurface.Resources>
<s:SciChartSurface.XAxis>
<s:CategoryDateTimeAxis />
</s:SciChartSurface.XAxis>
<s:SciChartSurface.YAxis>
<s:NumericAxis />
</s:SciChartSurface.YAxis>
<s:SciChartSurface.ChartModifier>
<s:ModifierGroup>
<s:AnnotationCreationModifier x:Name="AnnotationCreation" AnnotationCreated="OnAnnotationCreated" />
</s:ModifierGroup>
</s:SciChartSurface.ChartModifier>
</s:SciChartSurface>
</Grid>
</UserControl>
// *************************************************************************************
// SCICHART® Copyright SciChart Ltd. 2011-2022. All rights reserved.
//
// Web: http://www.scichart.com
// Support: support@scichart.com
// Sales: sales@scichart.com
//
// CompositeAnnotationsView.xaml.cs is part of the SCICHART® Examples. Permission is hereby granted
// to modify, create derivative works, distribute and publish any part of this source
// code whether for commercial, private or personal use.
//
// The SCICHART® examples are distributed in the hope that they will be useful, but
// without any warranty. It is provided "AS IS" without warranty of any kind, either
// expressed or implied.
// *************************************************************************************
using System;
using System.Windows;
using System.Windows.Controls;
using SciChart.Charting.Visuals.Annotations;
using SciChart.Examples.Examples.AnnotateAChart.CompositeAnnotations.FibonacciAnnotations;
using SciChart.Examples.Examples.AnnotateAChart.CompositeAnnotations.MeasureX;
using SciChart.Examples.Examples.AnnotateAChart.CompositeAnnotations.MeasureXy;
namespace SciChart.Examples.Examples.AnnotateAChart.CompositeAnnotations
{
/// <summary>
/// Interaction logic for CompositeAnnotationsView.xaml
/// </summary>
public partial class CompositeAnnotationsView : UserControl
{
public CompositeAnnotationsView()
{
InitializeComponent();
AnnotationCreation.IsEnabled = false;
}
private void OnAnnotationCreated(object sender, EventArgs e)
{
var newAnnotation = (AnnotationCreation.Annotation as AnnotationBase);
if (newAnnotation != null)
{
newAnnotation.IsEditable = true;
newAnnotation.CanEditText = true;
}
if (AnnotationCreation != null)
{
AnnotationCreation.IsEnabled = false;
}
foreach (var annotation in SciChart.Annotations)
{
annotation.IsEditable = true;
}
FibRetr.IsChecked = false;
FibExt.IsChecked = false;
MeasureX.IsChecked = false;
MeasureY.IsChecked = false;
MeasureXy.IsChecked = false;
}
private void FibonacciRetracementChecked(object sender, RoutedEventArgs e)
{
AnnotationCreation.IsEnabled = true;
AnnotationCreation.AnnotationType = typeof(FibonacciRetracementAnnotation);
}
private void FibonacciExtensionChecked(object sender, RoutedEventArgs e)
{
AnnotationCreation.IsEnabled = true;
AnnotationCreation.AnnotationType = typeof(FibonacciExtensionAnnotation);
}
private void MeasureXChecked(object sender, RoutedEventArgs e)
{
AnnotationCreation.IsEnabled = true;
AnnotationCreation.AnnotationType = typeof(MeasureXAnnotation);
}
private void MeasureYChecked(object sender, RoutedEventArgs e)
{
AnnotationCreation.IsEnabled = true;
AnnotationCreation.AnnotationType = typeof(MeasureY.MeasureYAnnotation);
}
private void MeasureXyChecked(object sender, RoutedEventArgs e)
{
AnnotationCreation.IsEnabled = true;
AnnotationCreation.AnnotationType = typeof(MeasureXyAnnotation);
}
private void AnnotationTypeUnchecked(object sender, RoutedEventArgs e)
{
AnnotationCreation.IsEnabled = false;
}
}
}
// *************************************************************************************
// SCICHART® Copyright SciChart Ltd. 2011-2022. All rights reserved.
//
// Web: http://www.scichart.com
// Support: support@scichart.com
// Sales: sales@scichart.com
//
// CompositeAnnotationsViewModel.cs is part of the SCICHART® Examples. Permission is hereby granted
// to modify, create derivative works, distribute and publish any part of this source
// code whether for commercial, private or personal use.
//
// The SCICHART® examples are distributed in the hope that they will be useful, but
// without any warranty. It is provided "AS IS" without warranty of any kind, either
// expressed or implied.
// *************************************************************************************
using System;
using System.Collections.Generic;
using SciChart.Charting.Model.ChartSeries;
using SciChart.Charting.Model.DataSeries;
using SciChart.Examples.ExternalDependencies.Common;
using SciChart.Examples.ExternalDependencies.Data;
namespace SciChart.Examples.Examples.AnnotateAChart.CompositeAnnotations
{
public class CompositeAnnotationsViewModel : BaseViewModel
{
public CompositeAnnotationsViewModel()
{
RenderableSeriesViewModels = new List<IRenderableSeriesViewModel>
{
new CandlestickRenderableSeriesViewModel {DataSeries = GetPriceDataSeries()}
};
}
public List<IRenderableSeriesViewModel> RenderableSeriesViewModels { get; set; }
private IOhlcDataSeries GetPriceDataSeries()
{
var stockPrices = new OhlcDataSeries<DateTime, double>();
var prices = DataManager.Instance.GetPriceData(Instrument.Indu.Value, TimeFrame.Daily);
stockPrices.Append(prices.TimeData, prices.OpenData, prices.HighData, prices.LowData, prices.CloseData);
return stockPrices;
}
}
}
// *************************************************************************************
// SCICHART® Copyright SciChart Ltd. 2011-2022. All rights reserved.
//
// Web: http://www.scichart.com
// Support: support@scichart.com
// Sales: sales@scichart.com
//
// FibonacciExtensionAnnotation.xaml.cs is part of the SCICHART® Examples. Permission is hereby granted
// to modify, create derivative works, distribute and publish any part of this source
// code whether for commercial, private or personal use.
//
// The SCICHART® examples are distributed in the hope that they will be useful, but
// without any warranty. It is provided "AS IS" without warranty of any kind, either
// expressed or implied.
// *************************************************************************************
using System.Windows.Media;
using SciChart.Charting.Visuals.Annotations;
namespace SciChart.Examples.Examples.AnnotateAChart.CompositeAnnotations.FibonacciAnnotations
{
public partial class FibonacciExtensionAnnotation : CompositeAnnotation
{
private readonly RatioModel[] _ratios =
{
new RatioModel(0d, new SolidColorBrush(Color.FromArgb(0xFF, 0x87, 0x77, 0x77))),
new RatioModel(0.236, new SolidColorBrush(Color.FromArgb(0xFF, 0xC7, 0x38, 0x28))),
new RatioModel(0.382, new SolidColorBrush(Color.FromArgb(0xFF, 0x8A, 0xCC, 0x28))),
new RatioModel(0.5, new SolidColorBrush(Color.FromArgb(0xFF, 0x28, 0xCC, 0x33))),
new RatioModel(0.618, new SolidColorBrush(Color.FromArgb(0xFF, 0x28, 0xC7, 0x9A))),
new RatioModel(0.764, new SolidColorBrush(Color.FromArgb(0xFF, 0x31, 0x93, 0xC5))),
new RatioModel(1d, new SolidColorBrush(Color.FromArgb(0xFF, 0x77, 0x77, 0x87))),
new RatioModel(1.618d, new SolidColorBrush(Color.FromArgb(0xFF, 0x28, 0x28, 0xCC))),
new RatioModel(2.618d, new SolidColorBrush(Color.FromArgb(0xFF, 0xCC, 0x28, 0x28))),
};
public FibonacciExtensionAnnotation()
{
InitializeComponent();
DataContext = new FibonacciRetracementViewModel(_ratios);
}
}
}
<s:CompositeAnnotation x:Class="SciChart.Examples.Examples.AnnotateAChart.CompositeAnnotations.FibonacciAnnotations.FibonacciExtensionAnnotation"
xmlns="http://schemas.microsoft.com/winfx/2006/xaml/presentation"
xmlns:x="http://schemas.microsoft.com/winfx/2006/xaml"
xmlns:s="http://schemas.abtsoftware.co.uk/scichart"
Annotations="{Binding Annotations, Mode=TwoWay}"
Canvas.ZIndex="99"
IsSelected="{Binding IsSelected}" />
// *************************************************************************************
// SCICHART® Copyright SciChart Ltd. 2011-2022. All rights reserved.
//
// Web: http://www.scichart.com
// Support: support@scichart.com
// Sales: sales@scichart.com
//
// FibonacciRatioBox.xaml.cs is part of the SCICHART® Examples. Permission is hereby granted
// to modify, create derivative works, distribute and publish any part of this source
// code whether for commercial, private or personal use.
//
// The SCICHART® examples are distributed in the hope that they will be useful, but
// without any warranty. It is provided "AS IS" without warranty of any kind, either
// expressed or implied.
// *************************************************************************************
using SciChart.Charting.Visuals.Annotations;
namespace SciChart.Examples.Examples.AnnotateAChart.CompositeAnnotations.FibonacciAnnotations
{
/// <summary>
/// Interaction logic for CustomTextAnnotation.xaml
/// </summary>
public partial class FibonacciRatioBox: BoxAnnotation
{
public FibonacciRatioBox()
{
InitializeComponent();
}
}
}
<s:BoxAnnotation x:Class="SciChart.Examples.Examples.AnnotateAChart.CompositeAnnotations.FibonacciAnnotations.FibonacciRatioBox"
xmlns="http://schemas.microsoft.com/winfx/2006/xaml/presentation"
xmlns:x="http://schemas.microsoft.com/winfx/2006/xaml"
xmlns:s="http://schemas.abtsoftware.co.uk/scichart"
Background="{Binding Background}"
CoordinateMode="Relative"
Opacity="0.2"
X1="0"
X2="1"
Y1="{Binding Y1}"
Y2="{Binding Y2}" />
// *************************************************************************************
// SCICHART® Copyright SciChart Ltd. 2011-2022. All rights reserved.
//
// Web: http://www.scichart.com
// Support: support@scichart.com
// Sales: sales@scichart.com
//
// FibonacciRatioBoxViewModel.cs is part of the SCICHART® Examples. Permission is hereby granted
// to modify, create derivative works, distribute and publish any part of this source
// code whether for commercial, private or personal use.
//
// The SCICHART® examples are distributed in the hope that they will be useful, but
// without any warranty. It is provided "AS IS" without warranty of any kind, either
// expressed or implied.
// *************************************************************************************
using System.Windows.Media;
namespace SciChart.Examples.Examples.AnnotateAChart.CompositeAnnotations.FibonacciAnnotations
{
public class FibonacciRatioBoxViewModel
{
public FibonacciRatioBoxViewModel(double y1, double y2, Brush background)
{
Y1 = 1 - y1;
Y2 = 1 - y2;
Background = background;
}
/// <summary>
/// Y1 defines the Y1 Data-Value for positioning the annotation
/// </summary>
public double Y1 { get; set; }
/// <summary>
/// Y2 defines the Y2 Data-Value for positioning the annotation
/// </summary>
public double Y2 { get; set; }
public Brush Background { get; set; }
}
}
// *************************************************************************************
// SCICHART® Copyright SciChart Ltd. 2011-2022. All rights reserved.
//
// Web: http://www.scichart.com
// Support: support@scichart.com
// Sales: sales@scichart.com
//
// FibonacciRatioLine.xaml.cs is part of the SCICHART® Examples. Permission is hereby granted
// to modify, create derivative works, distribute and publish any part of this source
// code whether for commercial, private or personal use.
//
// The SCICHART® examples are distributed in the hope that they will be useful, but
// without any warranty. It is provided "AS IS" without warranty of any kind, either
// expressed or implied.
// *************************************************************************************
using SciChart.Charting.Visuals.Annotations;
namespace SciChart.Examples.Examples.AnnotateAChart.CompositeAnnotations.FibonacciAnnotations
{
/// <summary>
/// Interaction logic for CustomTextAnnotation.xaml
/// </summary>
public partial class FibonacciRatioLine : HorizontalLineAnnotation
{
public FibonacciRatioLine()
{
InitializeComponent();
}
}
}
<s:HorizontalLineAnnotation x:Class="SciChart.Examples.Examples.AnnotateAChart.CompositeAnnotations.FibonacciAnnotations.FibonacciRatioLine"
xmlns="http://schemas.microsoft.com/winfx/2006/xaml/presentation"
xmlns:x="http://schemas.microsoft.com/winfx/2006/xaml"
xmlns:s="http://schemas.abtsoftware.co.uk/scichart"
HorizontalAlignment="Center"
CoordinateMode="Relative"
Foreground="White"
LabelPlacement="Left"
LabelValue="{Binding LabelValue}"
ShowLabel="True"
Stroke="{Binding Stroke}"
StrokeThickness="1"
X1="0"
X2="1"
Y1="{Binding Y1}" />
// *************************************************************************************
// SCICHART® Copyright SciChart Ltd. 2011-2022. All rights reserved.
//
// Web: http://www.scichart.com
// Support: support@scichart.com
// Sales: sales@scichart.com
//
// FibonacciRatioViewModel.cs is part of the SCICHART® Examples. Permission is hereby granted
// to modify, create derivative works, distribute and publish any part of this source
// code whether for commercial, private or personal use.
//
// The SCICHART® examples are distributed in the hope that they will be useful, but
// without any warranty. It is provided "AS IS" without warranty of any kind, either
// expressed or implied.
// *************************************************************************************
using System;
using System.Windows.Media;
namespace SciChart.Examples.Examples.AnnotateAChart.CompositeAnnotations.FibonacciAnnotations
{
public class FibonacciRatioViewModel
{
public FibonacciRatioViewModel(double y1, Brush stroke)
{
Y1 = 1 - y1;
Stroke = stroke;
}
/// <summary>
/// Y1 defines the Y Data-Value for positioning the annotation
/// </summary>
public double Y1 { get; set; }
/// <summary>
/// LabelText will allow us to bind to TextAnnotation.Text
/// </summary>
public string LabelValue { get { return string.Format("{0:#0.##%}", (Y1 >= 0 && Y1 <= 1 ? 1 - Y1 : Math.Abs(Y1 - 1))); } }
public Brush Stroke{ get; set; }
}
}
// *************************************************************************************
// SCICHART® Copyright SciChart Ltd. 2011-2022. All rights reserved.
//
// Web: http://www.scichart.com
// Support: support@scichart.com
// Sales: sales@scichart.com
//
// FibonacciRetracementAnnotation.xaml.cs is part of the SCICHART® Examples. Permission is hereby granted
// to modify, create derivative works, distribute and publish any part of this source
// code whether for commercial, private or personal use.
//
// The SCICHART® examples are distributed in the hope that they will be useful, but
// without any warranty. It is provided "AS IS" without warranty of any kind, either
// expressed or implied.
// *************************************************************************************
using System.Windows;
using System.Windows.Media;
using SciChart.Charting.Visuals.Annotations;
namespace SciChart.Examples.Examples.AnnotateAChart.CompositeAnnotations.FibonacciAnnotations
{
public partial class FibonacciRetracementAnnotation : CompositeAnnotation
{
private readonly RatioModel[] _ratios =
{
new RatioModel(0d, new SolidColorBrush(Color.FromArgb(0xFF, 0x87, 0x77, 0x77))),
new RatioModel(0.236, new SolidColorBrush(Color.FromArgb(0xFF, 0xC7, 0x38, 0x28))),
new RatioModel(0.382, new SolidColorBrush(Color.FromArgb(0xFF, 0x8A, 0xCC, 0x28))),
new RatioModel(0.5, new SolidColorBrush(Color.FromArgb(0xFF, 0x28, 0xCC, 0x33))),
new RatioModel(0.618, new SolidColorBrush(Color.FromArgb(0xFF, 0x28, 0xC7, 0x9A))),
new RatioModel(0.764, new SolidColorBrush(Color.FromArgb(0xFF, 0x31, 0x93, 0xC5))),
new RatioModel(1d, new SolidColorBrush(Color.FromArgb(0xFF, 0x77, 0x77, 0x87))),
};
public FibonacciRetracementAnnotation()
{
InitializeComponent();
}
private void FibonacciRetracementAnnotation_OnLoaded(object sender, RoutedEventArgs e)
{
DataContext = new FibonacciRetracementViewModel(_ratios);
}
}
}
<s:CompositeAnnotation x:Class="SciChart.Examples.Examples.AnnotateAChart.CompositeAnnotations.FibonacciAnnotations.FibonacciRetracementAnnotation"
xmlns="http://schemas.microsoft.com/winfx/2006/xaml/presentation"
xmlns:x="http://schemas.microsoft.com/winfx/2006/xaml"
xmlns:s="http://schemas.abtsoftware.co.uk/scichart"
Annotations="{Binding Annotations, Mode=TwoWay}"
Canvas.ZIndex="99"
IsSelected="{Binding IsSelected}" Loaded="FibonacciRetracementAnnotation_OnLoaded" />
// *************************************************************************************
// SCICHART® Copyright SciChart Ltd. 2011-2022. All rights reserved.
//
// Web: http://www.scichart.com
// Support: support@scichart.com
// Sales: sales@scichart.com
//
// FibonacciRetracementViewModel.cs is part of the SCICHART® Examples. Permission is hereby granted
// to modify, create derivative works, distribute and publish any part of this source
// code whether for commercial, private or personal use.
//
// The SCICHART® examples are distributed in the hope that they will be useful, but
// without any warranty. It is provided "AS IS" without warranty of any kind, either
// expressed or implied.
// *************************************************************************************
using System;
using System.Collections.ObjectModel;
using System.ComponentModel;
using System.Linq;
using System.Windows.Media;
using SciChart.Charting.Visuals.Annotations;
namespace SciChart.Examples.Examples.AnnotateAChart.CompositeAnnotations.FibonacciAnnotations
{
public class RatioModel
{
public RatioModel(double value, Brush brush)
{
Value = value;
Brush = brush;
}
public double Value { get; set; }
public Brush Brush { get; set; }
}
public class FibonacciRetracementViewModel : INotifyPropertyChanged
{
private bool _isSelected;
public FibonacciRetracementViewModel()
{
Annotations = new ObservableCollection<IAnnotation>();
}
public FibonacciRetracementViewModel(params RatioModel[] ratios) : this()
{
Annotations.Add(CreateFibonacciRatioLine(ratios[0].Value, ratios[0].Brush));
for (int i = 1; i < ratios.Length; i++)
{
Annotations.Add(CreateFibonacciRatioBox(ratios[i - 1].Value, ratios[i].Value, ratios[i].Brush));
Annotations.Add(CreateFibonacciRatioLine(ratios[i].Value, ratios[i].Brush));
}
Annotations.Add(CreateTrendLine(new DoubleCollection {2d, 4d}, 2d, new SolidColorBrush(Color.FromArgb(0xFF, 0xBA, 0xBA, 0xBA))));
}
/// <summary>
/// Gets or sets the <see cref="ObservableCollection{T}"/>
/// </summary>
public ObservableCollection<IAnnotation> Annotations { get; set; }
public bool IsSelected
{
get { return _isSelected; }
set
{
_isSelected = value;
OnPropertyChanged("IsSelected");
}
}
private IAnnotation CreateFibonacciRatioLine(double y1, Brush stroke)
{
return new FibonacciRatioLine
{
DataContext = new FibonacciRatioViewModel(y1, stroke)
};
}
private IAnnotation CreateFibonacciRatioBox(double y1, double y2, Brush background)
{
return new FibonacciRatioBox
{
DataContext = new FibonacciRatioBoxViewModel(y1, y2, background)
};
}
private IAnnotation CreateTrendLine(DoubleCollection strokeDashArray, double strokeThickness, Brush stroke)
{
return new TrendLine
{
DataContext = new TrendLineViewModel(strokeDashArray, strokeThickness, stroke)
};
}
public event PropertyChangedEventHandler PropertyChanged;
protected virtual void OnPropertyChanged(string propertyName)
{
var handler = PropertyChanged;
if (handler != null)
{
handler(this, new PropertyChangedEventArgs(propertyName));
}
}
}
}
// *************************************************************************************
// SCICHART® Copyright SciChart Ltd. 2011-2022. All rights reserved.
//
// Web: http://www.scichart.com
// Support: support@scichart.com
// Sales: sales@scichart.com
//
// TrendLine.xaml.cs is part of the SCICHART® Examples. Permission is hereby granted
// to modify, create derivative works, distribute and publish any part of this source
// code whether for commercial, private or personal use.
//
// The SCICHART® examples are distributed in the hope that they will be useful, but
// without any warranty. It is provided "AS IS" without warranty of any kind, either
// expressed or implied.
// *************************************************************************************
using SciChart.Charting.Visuals.Annotations;
namespace SciChart.Examples.Examples.AnnotateAChart.CompositeAnnotations.FibonacciAnnotations
{
/// <summary>
/// Interaction logic for CustomTextAnnotation.xaml
/// </summary>
public partial class TrendLine: LineAnnotation
{
public TrendLine()
{
InitializeComponent();
}
}
}
<s:LineAnnotation x:Class="SciChart.Examples.Examples.AnnotateAChart.CompositeAnnotations.FibonacciAnnotations.TrendLine"
xmlns="http://schemas.microsoft.com/winfx/2006/xaml/presentation"
xmlns:x="http://schemas.microsoft.com/winfx/2006/xaml"
xmlns:s="http://schemas.abtsoftware.co.uk/scichart"
CoordinateMode="Relative"
Canvas.ZIndex="1"
Stroke="{Binding Stroke, Mode=TwoWay}"
StrokeDashArray="{Binding StrokeDashArray, Mode=TwoWay}"
StrokeThickness="{Binding StrokeThickness, Mode=TwoWay}"
X1="0"
X2="1"
Y1="0"
Y2="1" />
// *************************************************************************************
// SCICHART® Copyright SciChart Ltd. 2011-2022. All rights reserved.
//
// Web: http://www.scichart.com
// Support: support@scichart.com
// Sales: sales@scichart.com
//
// TrendLineViewModel.cs is part of the SCICHART® Examples. Permission is hereby granted
// to modify, create derivative works, distribute and publish any part of this source
// code whether for commercial, private or personal use.
//
// The SCICHART® examples are distributed in the hope that they will be useful, but
// without any warranty. It is provided "AS IS" without warranty of any kind, either
// expressed or implied.
// *************************************************************************************
using System.Windows.Media;
namespace SciChart.Examples.Examples.AnnotateAChart.CompositeAnnotations.FibonacciAnnotations
{
public class TrendLineViewModel
{
public TrendLineViewModel(DoubleCollection strokeDashArray, double strokeThickness, Brush stroke)
{
StrokeDashArray = strokeDashArray;
StrokeThickness = strokeThickness;
Stroke = stroke;
}
public DoubleCollection StrokeDashArray { get; set; }
public double StrokeThickness{ get; set; }
public Brush Stroke { get; set; }
}
}
// *************************************************************************************
// SCICHART® Copyright SciChart Ltd. 2011-2022. All rights reserved.
//
// Web: http://www.scichart.com
// Support: support@scichart.com
// Sales: sales@scichart.com
//
// MeasureXAnnotation.xaml.cs is part of the SCICHART® Examples. Permission is hereby granted
// to modify, create derivative works, distribute and publish any part of this source
// code whether for commercial, private or personal use.
//
// The SCICHART® examples are distributed in the hope that they will be useful, but
// without any warranty. It is provided "AS IS" without warranty of any kind, either
// expressed or implied.
// *************************************************************************************
using System;
using System.Windows;
using SciChart.Charting.Numerics.CoordinateCalculators;
using SciChart.Charting.Visuals.Annotations;
using SciChart.Data.Model;
namespace SciChart.Examples.Examples.AnnotateAChart.CompositeAnnotations.MeasureX
{
public partial class MeasureXAnnotation : CompositeAnnotation
{
public MeasureXAnnotation()
{
InitializeComponent();
}
public override void Update(ICoordinateCalculator<double> xCoordCalc, ICoordinateCalculator<double> yCoordCalc)
{
base.Update(xCoordCalc, yCoordCalc);
if (Y1.CompareTo(Y2) > 0)
{
MeasureText.VerticalAnchorPoint = VerticalAnchorPoint.Top;
MeasureText.Margin = new Thickness(0, 5, 0, 0);
}
else
{
MeasureText.VerticalAnchorPoint = VerticalAnchorPoint.Bottom;
MeasureText.Margin = new Thickness(0, -5, 0, 0);
}
var range = X1.CompareTo(X2) > 0
? RangeFactory.NewRange(X2, X1)
: RangeFactory.NewRange(X1, X2);
if (xCoordCalc is ICategoryCoordinateCalculator<DateTime>)
{
var categoryCalc = (ICategoryCoordinateCalculator<DateTime>) xCoordCalc;
var indexRange = (IntegerRange)range;
var difference = categoryCalc.TransformIndexToData(indexRange.Max) - categoryCalc.TransformIndexToData(indexRange.Min);
MeasureText.Text = string.Format("{0:dd} days", difference);
}
else
{
MeasureText.Text = range.Diff.ToString();
}
}
}
}
<s:CompositeAnnotation x:Class="SciChart.Examples.Examples.AnnotateAChart.CompositeAnnotations.MeasureX.MeasureXAnnotation"
xmlns="http://schemas.microsoft.com/winfx/2006/xaml/presentation"
xmlns:x="http://schemas.microsoft.com/winfx/2006/xaml"
xmlns:s="http://schemas.abtsoftware.co.uk/scichart"
Canvas.ZIndex="1">
<s:CompositeAnnotation.Annotations>
<s:BoxAnnotation Background="#FFBADAFF"
CoordinateMode="Relative"
Opacity="0.3"
X1="0"
X2="1"
Y1="0"
Y2="1" />
<s:LineArrowAnnotation CoordinateMode="Relative"
Stroke="#FFBADAFF"
StrokeDashArray="2,4"
StrokeThickness="1"
X1="0"
X2="1"
Y1="0.5"
Y2="0.5" />
<s:LineAnnotation CoordinateMode="Relative"
Stroke="#FFBADAFF"
StrokeThickness="1"
X1="0"
X2="0"
Y1="0"
Y2="1" />
<s:LineAnnotation CoordinateMode="Relative"
Stroke="#FFBADAFF"
StrokeThickness="1"
X1="1"
X2="1"
Y1="0"
Y2="1" />
<s:TextAnnotation x:Name="MeasureText"
Background="CornflowerBlue"
CoordinateMode="Relative"
CornerRadius="3"
Foreground="White"
HorizontalAnchorPoint="Center"
X1="0.5"
Y1="1"/>
</s:CompositeAnnotation.Annotations>
</s:CompositeAnnotation>
// *************************************************************************************
// SCICHART® Copyright SciChart Ltd. 2011-2022. All rights reserved.
//
// Web: http://www.scichart.com
// Support: support@scichart.com
// Sales: sales@scichart.com
//
// MeasureXyAnnotation.xaml.cs is part of the SCICHART® Examples. Permission is hereby granted
// to modify, create derivative works, distribute and publish any part of this source
// code whether for commercial, private or personal use.
//
// The SCICHART® examples are distributed in the hope that they will be useful, but
// without any warranty. It is provided "AS IS" without warranty of any kind, either
// expressed or implied.
// *************************************************************************************
using System;
using System.Windows;
using SciChart.Charting.Numerics.CoordinateCalculators;
using SciChart.Charting.Visuals.Annotations;
using SciChart.Data.Model;
namespace SciChart.Examples.Examples.AnnotateAChart.CompositeAnnotations.MeasureXy
{
public partial class MeasureXyAnnotation : CompositeAnnotation
{
public MeasureXyAnnotation()
{
InitializeComponent();
}
public override void Update(ICoordinateCalculator<double> xCoordCalc, ICoordinateCalculator<double> yCoordCalc)
{
base.Update(xCoordCalc, yCoordCalc);
if (Y1.CompareTo(Y2) > 0)
{
MeasureText.VerticalAnchorPoint = VerticalAnchorPoint.Top;
MeasureText.Margin = new Thickness(0, 5, 0, 0);
}
else
{
MeasureText.VerticalAnchorPoint = VerticalAnchorPoint.Bottom;
MeasureText.Margin = new Thickness(0, -5, 0, 0);
}
var rangeX = X1.CompareTo(X2) > 0 ? RangeFactory.NewRange(X2, X1) : RangeFactory.NewRange(X1, X2);
var rangeY = Y1.CompareTo(Y2) > 0 ? RangeFactory.NewRange(Y2, Y1) : RangeFactory.NewRange(Y1, Y2);
string xText;
if (xCoordCalc is ICategoryCoordinateCalculator<DateTime>)
{
var categoryCalc = (ICategoryCoordinateCalculator<DateTime>) xCoordCalc;
var indexRange = (IntegerRange)rangeX;
var difference = categoryCalc.TransformIndexToData(indexRange.Max) - categoryCalc.TransformIndexToData(indexRange.Min);
xText = string.Format("{0:dd} days", difference);
}
else
{
xText = rangeX.Diff.ToString();
}
MeasureText.Text = string.Format("{0:#.##}\n{1}", rangeY.Diff, xText);
}
}
}
<s:CompositeAnnotation x:Class="SciChart.Examples.Examples.AnnotateAChart.CompositeAnnotations.MeasureXy.MeasureXyAnnotation"
xmlns="http://schemas.microsoft.com/winfx/2006/xaml/presentation"
xmlns:x="http://schemas.microsoft.com/winfx/2006/xaml"
xmlns:s="http://schemas.abtsoftware.co.uk/scichart"
Canvas.ZIndex="1">
<s:CompositeAnnotation.Annotations>
<s:BoxAnnotation Background="#FFBADAFF"
CoordinateMode="Relative"
Opacity="0.3"
X1="0"
X2="1"
Y1="0"
Y2="1" />
<s:LineArrowAnnotation CoordinateMode="Relative"
Stroke="#FFBADAFF"
StrokeDashArray="2,4"
StrokeThickness="1"
X1="0"
X2="1"
Y1="0.5"
Y2="0.5" />
<s:LineArrowAnnotation CoordinateMode="Relative"
Stroke="#FFBADAFF"
StrokeDashArray="2,4"
StrokeThickness="1"
X1="0.5"
X2="0.5"
Y1="0"
Y2="1" />
<s:TextAnnotation x:Name="MeasureText"
Background="CornflowerBlue"
CoordinateMode="Relative"
CornerRadius="3"
Foreground="White"
HorizontalAnchorPoint="Center"
X1="0.5"
Y1="1"/>
</s:CompositeAnnotation.Annotations>
</s:CompositeAnnotation>
// *************************************************************************************
// SCICHART® Copyright SciChart Ltd. 2011-2022. All rights reserved.
//
// Web: http://www.scichart.com
// Support: support@scichart.com
// Sales: sales@scichart.com
//
// MeasureYAnnotation.xaml.cs is part of the SCICHART® Examples. Permission is hereby granted
// to modify, create derivative works, distribute and publish any part of this source
// code whether for commercial, private or personal use.
//
// The SCICHART® examples are distributed in the hope that they will be useful, but
// without any warranty. It is provided "AS IS" without warranty of any kind, either
// expressed or implied.
// *************************************************************************************
using System.Windows;
using SciChart.Charting.Numerics.CoordinateCalculators;
using SciChart.Charting.Visuals.Annotations;
using SciChart.Data.Model;
namespace SciChart.Examples.Examples.AnnotateAChart.CompositeAnnotations.MeasureY
{
public partial class MeasureYAnnotation : CompositeAnnotation
{
public MeasureYAnnotation()
{
InitializeComponent();
}
public override void Update(ICoordinateCalculator<double> xCoordCalc, ICoordinateCalculator<double> yCoordCalc)
{
base.Update(xCoordCalc, yCoordCalc);
if (Y1.CompareTo(Y2) > 0)
{
MeasureText.VerticalAnchorPoint = VerticalAnchorPoint.Top;
MeasureText.Margin = new Thickness(0, 5, 0, 0);
}
else
{
MeasureText.VerticalAnchorPoint = VerticalAnchorPoint.Bottom;
MeasureText.Margin = new Thickness(0, -5, 0, 0);
}
var range = Y1.CompareTo(Y2) > 0
? RangeFactory.NewRange(Y2, Y1)
: RangeFactory.NewRange(Y1, Y2);
MeasureText.Text = string.Format("{0:#.##}", range.Diff);
}
}
}
<s:CompositeAnnotation x:Class="SciChart.Examples.Examples.AnnotateAChart.CompositeAnnotations.MeasureY.MeasureYAnnotation"
xmlns="http://schemas.microsoft.com/winfx/2006/xaml/presentation"
xmlns:x="http://schemas.microsoft.com/winfx/2006/xaml"
xmlns:s="http://schemas.abtsoftware.co.uk/scichart"
x:Name="Measure"
Canvas.ZIndex="1">
<s:CompositeAnnotation.Annotations>
<s:BoxAnnotation Background="#FFBADAFF"
CoordinateMode="Relative"
Opacity="0.3"
X1="0"
X2="1"
Y1="0"
Y2="1" />
<s:LineArrowAnnotation CoordinateMode="Relative"
Stroke="#FFBADAFF"
StrokeDashArray="2,4"
StrokeThickness="1"
X1="0.5"
X2="0.5"
Y1="0"
Y2="1" />
<s:LineAnnotation CoordinateMode="Relative"
Stroke="#FFBADAFF"
StrokeThickness="1"
X1="0"
X2="1"
Y1="0"
Y2="0" />
<s:LineAnnotation CoordinateMode="Relative"
Stroke="#FFBADAFF"
StrokeThickness="1"
X1="0"
X2="1"
Y1="1"
Y2="1" />
<s:TextAnnotation x:Name="MeasureText"
Background="CornflowerBlue"
CoordinateMode="Relative"
CornerRadius="3"
Foreground="White"
HorizontalAnchorPoint="Center"
X1="0.5"
Y1="1"/>
</s:CompositeAnnotation.Annotations>
</s:CompositeAnnotation>