SciChart® the market leader in Fast WPF Charts, WPF 3D Charts, iOS Chart, Android Chart and JavaScript Chart Components
SciChart WPF ships with hundreds of WPF Chart Examples which you can browse, play with, view the source-code and even export each WPF Chart Example to a stand-alone Visual Studio solution. All of this is possible with the new and improved SciChart WPF Examples Suite, which ships as part of the SciChart WPF SDK.
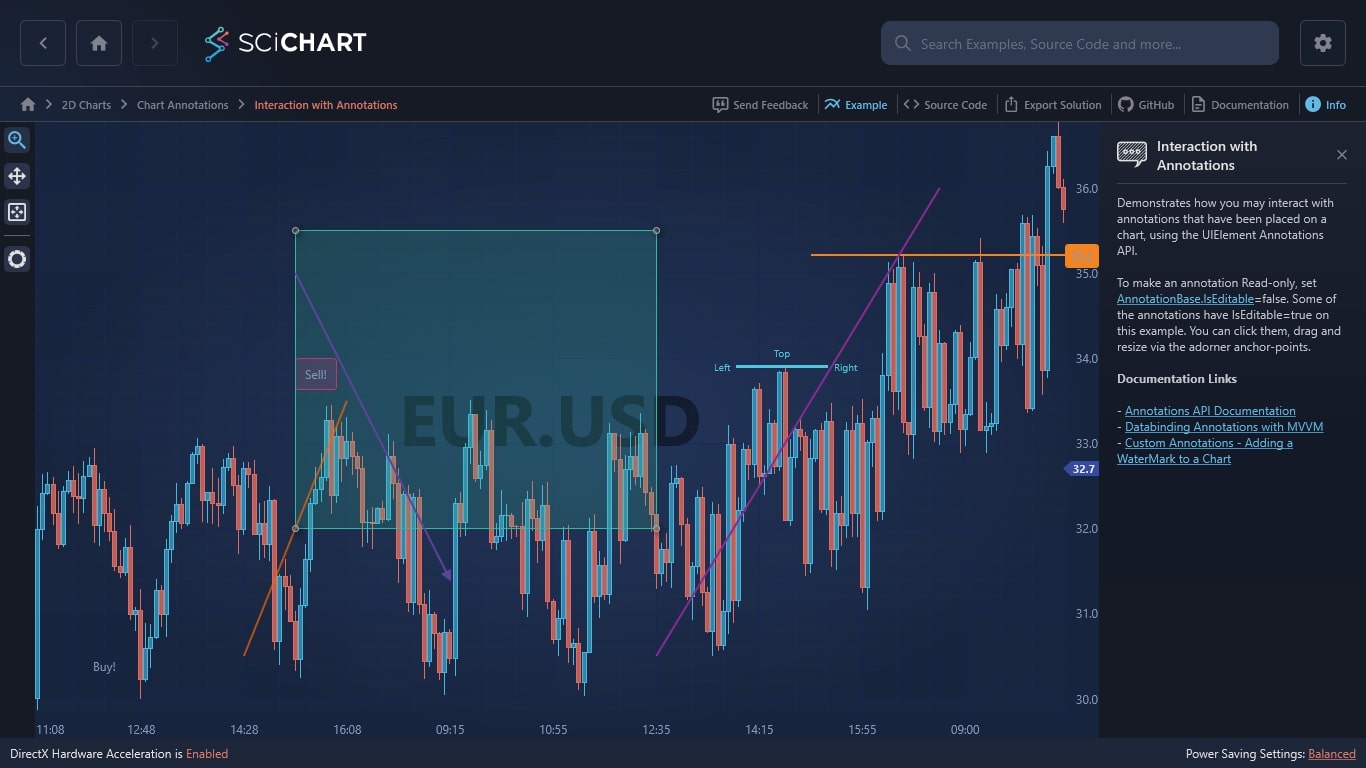
Demonstrates how you may interact with annotations that have been placed on a chart, using the UIElement Annotations API.
To make an annotation Read-only, set AnnotationBase.IsEditable=false. Some of the annotations have IsEditable=true on this example. You can click them, drag and resize via the adorner anchor-points.
Documentation Links
– Annotations API Documentation
– Databinding Annotations with MVVM
– Custom Annotations – Adding a WaterMark to a Chart
The C#/WPF source code for the WPF Chart Interaction with Annotations example is included below (Scroll down!).
Did you know you can also view the source code from one of the following sources as well?
<UserControl x:Class="SciChart.Examples.Examples.AnnotateAChart.InteractionWithAnnotations"
xmlns="http://schemas.microsoft.com/winfx/2006/xaml/presentation"
xmlns:x="http://schemas.microsoft.com/winfx/2006/xaml"
xmlns:s="http://schemas.abtsoftware.co.uk/scichart"
Loaded="InteractionWithAnnotationsLoaded"
xmlns:mc="http://schemas.openxmlformats.org/markup-compatibility/2006"
xmlns:d="http://schemas.microsoft.com/expression/blend/2008"
xmlns:ext="http://schemas.abtsoftware.co.uk/scichart/exampleExternals"
d:DesignHeight="400"
d:DesignWidth="600"
mc:Ignorable="d">
<UserControl.Resources>
<Style x:Key="sideLabel" TargetType="s:AnnotationLabel">
<Setter Property="FontSize" Value="10" />
<Setter Property="Foreground" Value="{Binding Stroke}" />
<Setter Property="Margin" Value="2,0,2,0" />
</Style>
</UserControl.Resources>
<Grid>
<Grid.ColumnDefinitions>
<ColumnDefinition Width="Auto" />
<ColumnDefinition Width="*" />
</Grid.ColumnDefinitions>
<!-- The SciChartInteractionToolbar adds zoom, pan, zoom extents and rotate functionality -->
<!-- to the chart and is included for example purposes. -->
<!-- If you wish to know how to zoom and pan a chart then do a search for Zoom Pan in the Examples suite! -->
<ext:SciChartInteractionToolbar TargetSurface="{Binding Source={x:Reference Name=sciChart}}" />
<s:SciChartSurface x:Name="sciChart"
Grid.Column="1"
Padding="0"
BorderThickness="0"
ClipModifierSurface="True">
<s:SciChartSurface.RenderableSeries>
<s:FastCandlestickRenderableSeries />
</s:SciChartSurface.RenderableSeries>
<s:SciChartSurface.XAxis>
<s:CategoryDateTimeAxis DrawMajorBands="True"/>
</s:SciChartSurface.XAxis>
<s:SciChartSurface.YAxis>
<s:NumericAxis TextFormatting="0.0#" DrawMajorBands="True"/>
</s:SciChartSurface.YAxis>
<s:SciChartSurface.Annotations>
<s:HorizontalLineAnnotation x:Name="rightAligned"
HorizontalAlignment="Right"
IsEditable="True"
LabelPlacement="Axis"
ShowLabel="True"
Stroke="Red"
StrokeThickness="2"
X1="150"
Y1="35.2" />
<s:TextAnnotation Margin="0"
AnnotationCanvas="BelowChart"
CoordinateMode="Relative"
FontSize="72"
FontWeight="Bold"
Foreground="#77000000"
HorizontalAnchorPoint="Center"
Padding="0"
Text="EUR.USD"
TextAlignment="Center"
VerticalAnchorPoint="Center"
X1="0.5"
Y1="0.5" />
<s:TextAnnotation IsEditable="True"
Text="Buy!"
X1="10"
Y1="30.5" />
<s:TextAnnotation Background="#33FF3333"
BorderBrush="#FF3333"
BorderThickness="1"
CornerRadius="3"
IsEditable="True"
Padding="5"
Text="Sell!"
TextAlignment="Center"
X1="50"
Y1="34" />
<s:BoxAnnotation Background="#33FF6600"
BorderBrush="#77FF6600"
BorderThickness="1"
CornerRadius="3"
IsEditable="True"
IsSelected="True"
X1="50"
X2="120"
Y1="35.5"
Y2="32" />
<s:LineAnnotation IsEditable="True"
Stroke="#AAFF6600"
StrokeThickness="2.0"
X1="40"
X2="60"
Y1="30.5"
Y2="33.5" />
<s:LineAnnotation IsEditable="true"
Stroke="#AAFF6600"
StrokeThickness="2.0"
X1="120"
X2="175"
Y1="30.5"
Y2="36" />
<s:LineArrowAnnotation HeadLength="4"
HeadWidth="8"
IsEditable="true"
X1="50"
X2="80"
Y1="35"
Y2="31.4" />
<s:AxisMarkerAnnotation Background="#FF6600"
FontSize="11"
FontWeight="Bold"
Foreground="#EEE"
IsEditable="true"
Y1="32.7" />
<s:HorizontalLineAnnotation x:Name="centered"
HorizontalAlignment="Center"
IsEditable="true"
Stroke="Blue"
StrokeThickness="3"
X1="130"
X2="160"
Y1="33.9">
<s:AnnotationLabel LabelPlacement="Left" LabelStyle="{StaticResource sideLabel}" Text="Left" />
<s:AnnotationLabel LabelPlacement="Top"
LabelStyle="{StaticResource sideLabel}"
Text="Top" />
<s:AnnotationLabel LabelPlacement="Right" LabelStyle="{StaticResource sideLabel}" Text="Right" >
</s:AnnotationLabel>
</s:HorizontalLineAnnotation>
</s:SciChartSurface.Annotations>
</s:SciChartSurface>
</Grid>
</UserControl>
// *************************************************************************************
// SCICHART® Copyright SciChart Ltd. 2011-2022. All rights reserved.
//
// Web: http://www.scichart.com
// Support: support@scichart.com
// Sales: sales@scichart.com
//
// InteractionWithAnnotations.xaml.cs is part of the SCICHART® Examples. Permission is hereby granted
// to modify, create derivative works, distribute and publish any part of this source
// code whether for commercial, private or personal use.
//
// The SCICHART® examples are distributed in the hope that they will be useful, but
// without any warranty. It is provided "AS IS" without warranty of any kind, either
// expressed or implied.
// *************************************************************************************
using System;
using System.Linq;
using System.Windows;
using System.Windows.Controls;
using SciChart.Charting.Model.DataSeries;
using SciChart.Examples.ExternalDependencies.Data;
namespace SciChart.Examples.Examples.AnnotateAChart
{
/// <summary>
/// Interaction logic for InteractionWithAnnotations.xaml
/// </summary>
public partial class InteractionWithAnnotations : UserControl
{
public InteractionWithAnnotations()
{
InitializeComponent();
}
void InteractionWithAnnotationsLoaded(object sender, RoutedEventArgs e)
{
var series = new OhlcDataSeries<DateTime, double>();
var marketDataService = new MarketDataService(DateTime.Now, 5, 5);
var data = marketDataService.GetHistoricalData(200);
series.Append(data.Select(x => x.DateTime), data.Select(x => x.Open), data.Select(x => x.High), data.Select(x => x.Low), data.Select(x => x.Close));
sciChart.RenderableSeries[0].DataSeries = series;
}
}
}