WPF Chart - Examples
SciChart WPF ships with hundreds of WPF Chart Examples which you can browse, play with, view the source-code and even export each WPF Chart Example to a stand-alone Visual Studio solution. All of this is possible with the new and improved SciChart WPF Examples Suite, which ships as part of the SciChart WPF SDK.
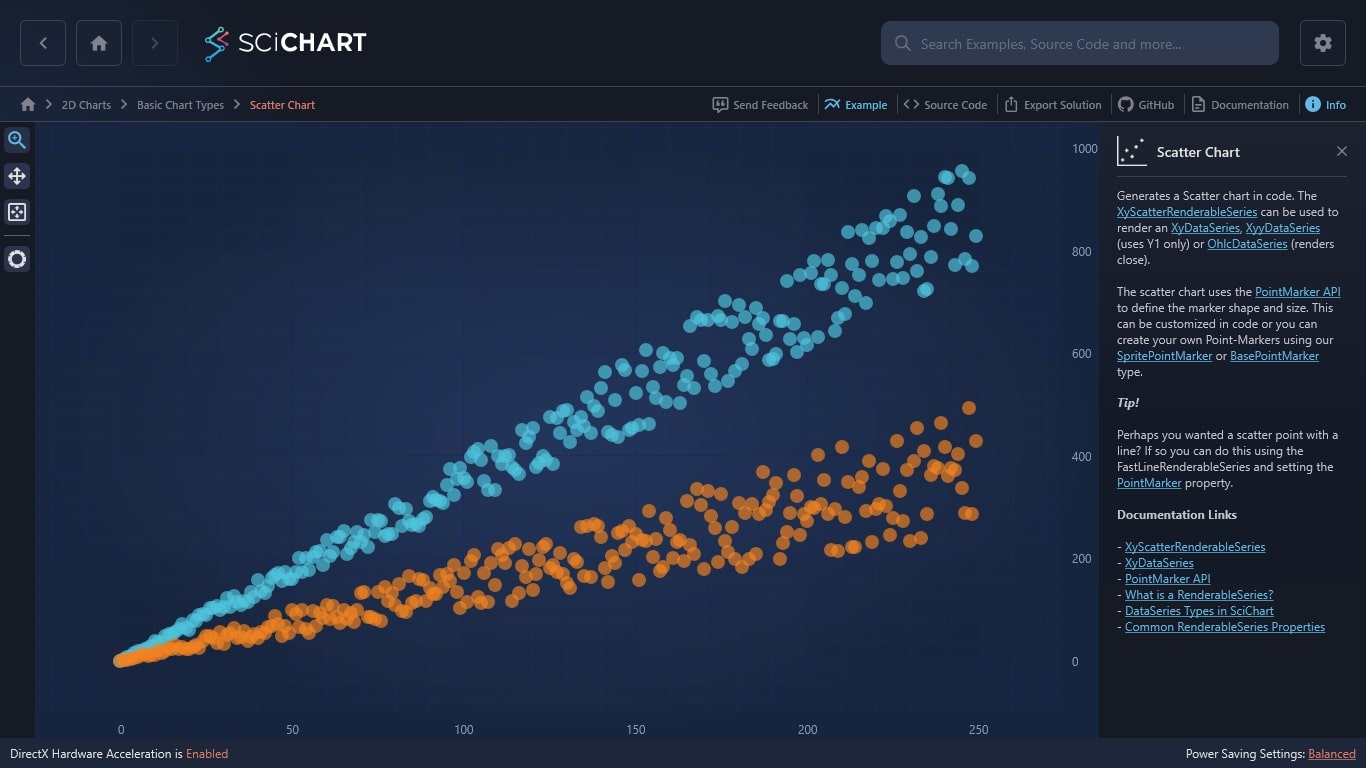
Generates a WPF Scatter chart in code. The XyScatterRenderableSeries can be used to render an XyDataSeries, XyyDataSeries (uses Y1 only) or OhlcDataSeries (renders close).
The scatter chart uses the PointMarker API to define the marker shape and size. This can be customized in code or you can create your own Point-Markers using our SpritePointMarker or BasePointMarker type.
Tip!
Perhaps you wanted a scatter point with a line? If so you can do this using the FastLineRenderableSeries and setting the PointMarker property.
Documentation Links
– XyScatterRenderableSeries
– XyDataSeries
– PointMarker API
– What is a RenderableSeries?
– DataSeries Types in SciChart
– Common RenderableSeries Properties

The C#/WPF source code for the WPF Scatter Chart example is included below (Scroll down!).
Did you know you can also view the source code from one of the following sources as well?
- Clone the SciChart.WPF.Examples from Github.
- Or, view source in the SciChart WPF Examples suite.
- Also the SciChart WPF Trial contains the full source for the examples (link below).
