WPF Chart - Examples
SciChart WPF ships with hundreds of WPF Chart Examples which you can browse, play with, view the source-code and even export each WPF Chart Example to a stand-alone Visual Studio solution. All of this is possible with the new and improved SciChart WPF Examples Suite, which ships as part of the SciChart WPF SDK.
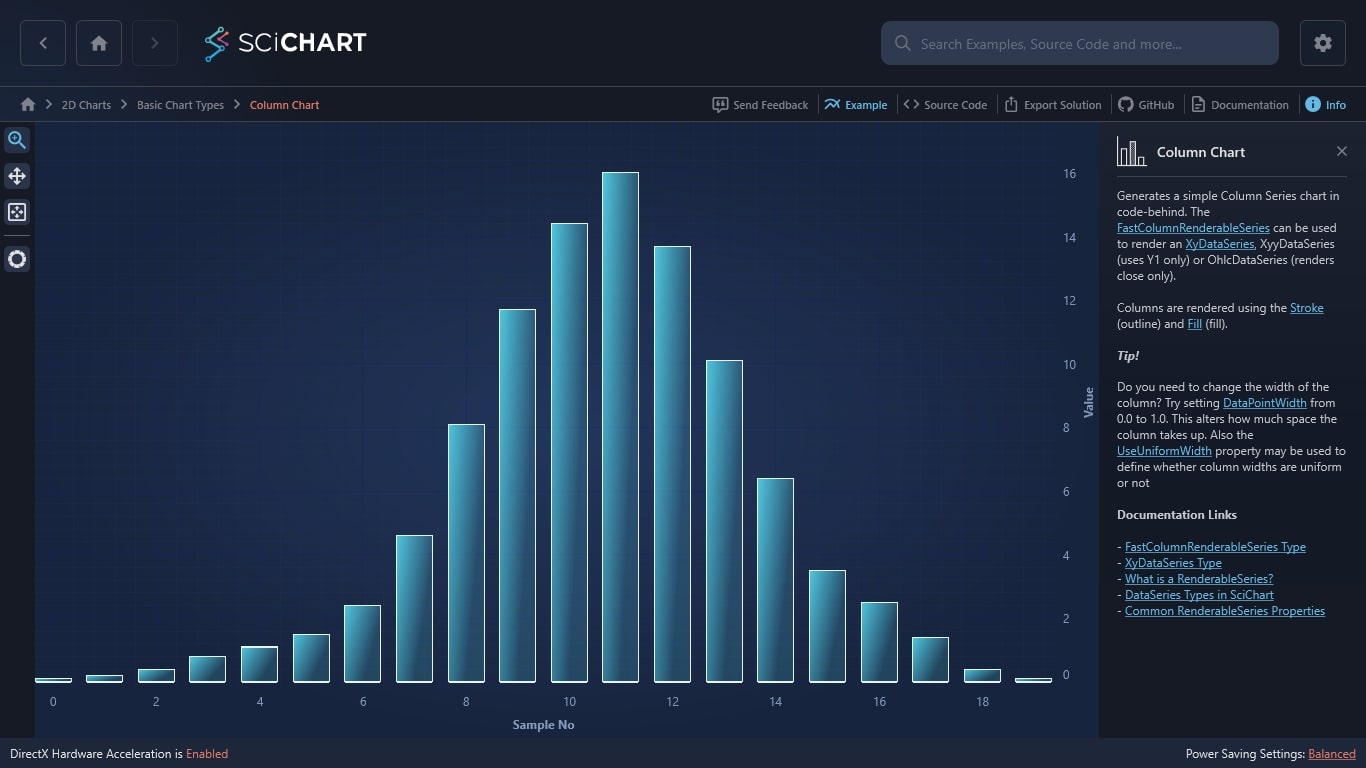
With our WPF chart library, you can generate a simple Column Series chart in code-behind. The FastColumnRenderableSeries can be used to render an XyDataSeries, XyyDataSeries (uses Y1 only) or OhlcDataSeries (renders close only).
Columns are rendered using the Stroke (outline) and Fill (fill).
Tip!
Do you need to change the width of the column? Try setting DataPointWidth from 0.0 to 1.0. This alters how much space the column takes up. Also the UseUniformWidth property may be used to define whether column widths are uniform or not
Documentation Links
– FastColumnRenderableSeries Type
– XyDataSeries Type
– What is a RenderableSeries?
– DataSeries Types in SciChart
– Common RenderableSeries Properties
Custom Color Maps
SciChart.WPF PaletteProvider API makes it easy to give your charts a unique look. Add custom fill colors, including gradient options, and assign unique colors to individual data points. With the ability to create custom themes, if you can imagine it, you can create it with SciChart.
Dealing with high amounts of data
SciChart.WPF doesn’t just give you total flexibility to modify the look and feel of your charts – it allows you to build more ambitious and expansive charts than you ever thought possible. Supporting millions of individual data points, SciChart allows you to create high-performance 3D point clouds or vast, detailed 2D graphs.
Use cases and industries
Column charts are extremely versatile and widely used; sometimes, there’s just no better way of presenting and comparing two distinct metrics. They’re great for analyzing data over a period of time, too.
SciChart is used by businesses in a whole host of different sectors, including pharmaceutical, oil and gas, medical, instrumentation, defence, aerospace, motorsport, process automation, mining, investment banking, trading and more.
Ready to create a WPF column chart?
How does it work?
The C#/WPF source code for the WPF Column Chart example is included below.
You can also view the source code from one of the following sources:
- Clone the SciChart.WPF.Examples from Github.
- Or, view source in the SciChart WPF Examples suite.
- Also, the SciChart WPF Trial contains the full source for the examples.
Download the WPF chart examples or begin your free trial today.
How to get started
Ready to get started with your free 30-day trial? Read our Getting Started guide before you do – it teaches you how to…
- Begin your free trial
- Learn how to create charts with tutorials
- Compile example source code
- Access documentation
So, what are you waiting for? Bring that project you’ve been thinking about to life with a free trial of SciChart.WPF.
Get started with your free trial today
Why use SciChart?
- Fast rendering for real-time data feeds
- Supports customisable, interactive features
- Five-star rated support for developers
- Winner of the Queen’s Award for Innovation
- Extensive features for complex charts
FAQs
What support will I get as a developer?
All developers gain access to our thriving online support forum when their free trial starts, and paying customers benefit from a convenient support ticket system. If you have a question or need assistance, we’re never far away.
How much does SciChart cost?
Prices start at $59 per developer, per month, although we offer a range of different packages to suit your company’s needs.
How fast are your WPF charts?
SciChart delivers the fastest WPF charts around – we’ve carried out extensive performance testing against competitors to prove it. It’s no wonder our charts are used by no less than five Formula One teams!

The C#/WPF source code for the WPF Column Chart example is included below (Scroll down!).
Did you know you can also view the source code from one of the following sources as well?
- Clone the SciChart.WPF.Examples from Github.
- Or, view source in the SciChart WPF Examples suite.
- Also the SciChart WPF Trial contains the full source for the examples (link below).
