SciChart® the market leader in Fast WPF Charts, WPF 3D Charts, iOS Chart, Android Chart and JavaScript Chart Components
SciChart WPF ships with hundreds of WPF Chart Examples which you can browse, play with, view the source-code and even export each WPF Chart Example to a stand-alone Visual Studio solution. All of this is possible with the new and improved SciChart WPF Examples Suite, which ships as part of the SciChart WPF SDK.
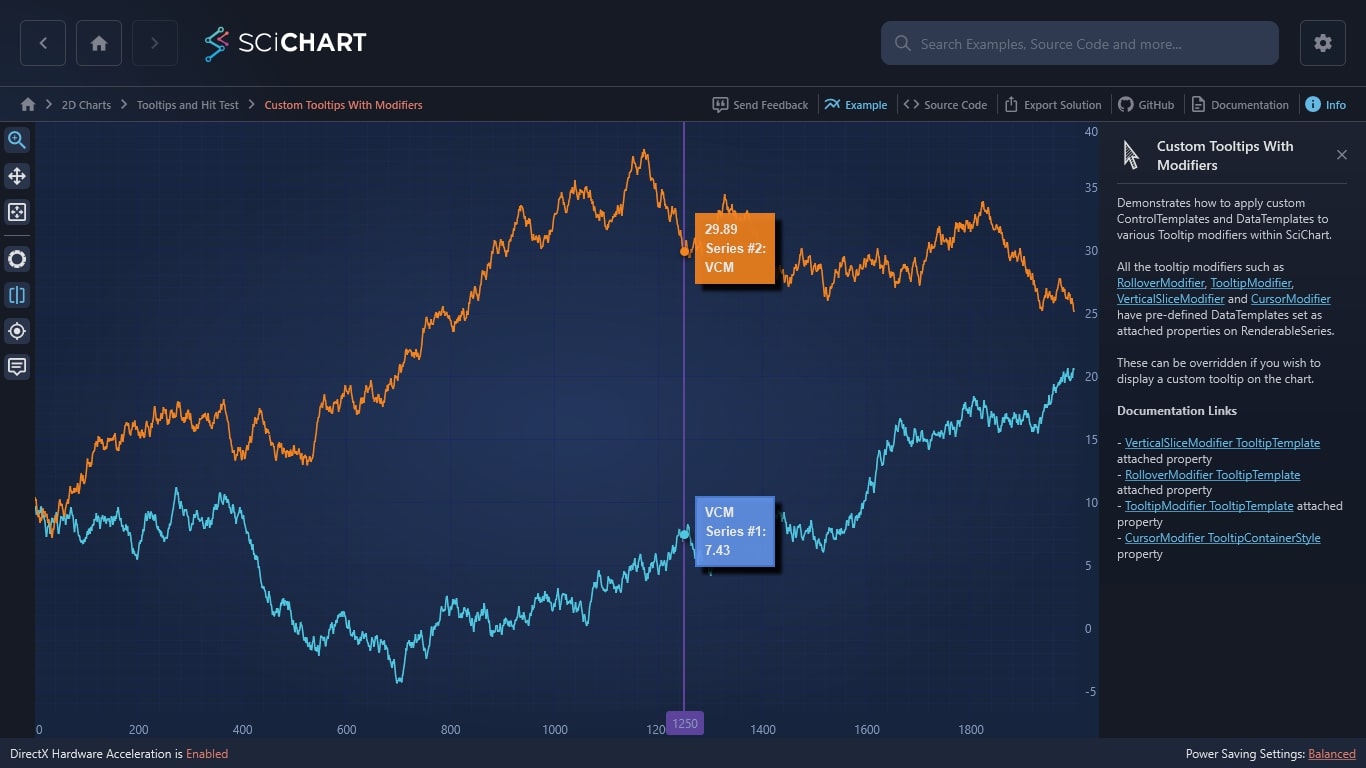
Demonstrates how to apply custom ControlTemplates and DataTemplates to various Tooltip modifiers within SciChart.
All the tooltip modifiers such as RolloverModifier, TooltipModifier, VerticalSliceModifier and CursorModifier have pre-defined DataTemplates set as attached properties on RenderableSeries.
These can be overridden if you wish to display a custom tooltip on the chart.
Documentation Links
– VerticalSliceModifier TooltipTemplate attached property
– RolloverModifier TooltipTemplate attached property
– TooltipModifier TooltipTemplate attached property
– CursorModifier TooltipContainerStyle property
The C#/WPF source code for the WPF Chart Custom Tooltip Templates example is included below (Scroll down!).
Did you know you can also view the source code from one of the following sources as well?
<UserControl x:Class="SciChart.Examples.Examples.InspectDatapoints.CustomTooltipsWithModifiers"
xmlns="http://schemas.microsoft.com/winfx/2006/xaml/presentation"
xmlns:x="http://schemas.microsoft.com/winfx/2006/xaml"
xmlns:d="http://schemas.microsoft.com/expression/blend/2008"
xmlns:ext="http://schemas.abtsoftware.co.uk/scichart/exampleExternals"
xmlns:mc="http://schemas.openxmlformats.org/markup-compatibility/2006"
xmlns:s="http://schemas.abtsoftware.co.uk/scichart"
d:DesignHeight="400"
d:DesignWidth="600"
mc:Ignorable="d">
<UserControl.Resources>
<DropShadowEffect x:Key="DropShadowEffect"
BlurRadius="5"
Direction="-45"
ShadowDepth="10"
Color="Black" />
<Style x:Key="TooltipStyle1" TargetType="s:TooltipControl">
<Setter Property="Template">
<Setter.Value>
<ControlTemplate TargetType="s:TooltipControl">
<Border Background="#ff6495ed"
BorderBrush="#ff4d81dd"
BorderThickness="2"
Effect="{StaticResource DropShadowEffect}"
Margin="0,0,10,10"
Padding="5"
Opacity="0.9">
<ContentPresenter Content="{TemplateBinding DataContext}" ContentTemplate="{TemplateBinding ContentTemplate}" />
</Border>
</ControlTemplate>
</Setter.Value>
</Setter>
</Style>
<Style x:Key="TooltipStyle2" TargetType="s:TooltipControl">
<Setter Property="Template">
<Setter.Value>
<ControlTemplate TargetType="s:TooltipControl">
<Border Background="#ffe2460c"
BorderBrush="#ffff4500"
BorderThickness="2"
Effect="{StaticResource DropShadowEffect}"
Margin="0,0,10,10"
Padding="5"
Opacity="0.9">
<ContentPresenter Content="{TemplateBinding DataContext}" ContentTemplate="{TemplateBinding ContentTemplate}" />
</Border>
</ControlTemplate>
</Setter.Value>
</Setter>
</Style>
<Style x:Key="CursorTooltipStyle" TargetType="s:CursorLabelControl">
<Setter Property="Template">
<Setter.Value>
<ControlTemplate TargetType="s:CursorLabelControl">
<Border Background="#ffe2460c"
BorderBrush="#ffff4500"
BorderThickness="2"
Effect="{StaticResource DropShadowEffect}"
Margin="0,0,10,10"
Padding="5"
Opacity="0.9">
<ItemsControl Margin="6" ItemsSource="{Binding DataContext.SeriesData.SeriesInfo, RelativeSource={RelativeSource TemplatedParent}}">
<ItemsControl.ItemTemplate>
<DataTemplate DataType="s:SeriesInfo">
<ContentControl Content="{Binding}" ContentTemplate="{Binding Path=RenderableSeries.(s:CursorModifier.TooltipTemplate)}" />
</DataTemplate>
</ItemsControl.ItemTemplate>
</ItemsControl>
</Border>
</ControlTemplate>
</Setter.Value>
</Setter>
</Style>
<Style x:Key="CursorLineStyle" TargetType="Line">
<Setter Property="StrokeThickness" Value="1" />
<Setter Property="Stroke" Value="#AAFFA500" />
</Style>
<Style x:Key="CursorAxisLabelStyle" TargetType="s:AxisLabelControl">
<Setter Property="Background" Value="#FFFFA500" />
<Setter Property="Foreground" Value="White" />
</Style>
<!-- Label used in cursors -->
<Style x:Key="HintDataItemsStyle" TargetType="TextBlock">
<Setter Property="Foreground" Value="White" />
<Setter Property="FontWeight" Value="Bold" />
<Setter Property="FontFamily" Value="Arial" />
<Setter Property="FontSize" Value="13" />
<Setter Property="Margin" Value="3,2,2,2" />
</Style>
<DataTemplate x:Key="RolloverTooltipTemplate1" DataType="s:SeriesInfo">
<StackPanel Orientation="Vertical">
<TextBlock Style="{StaticResource HintDataItemsStyle}" Text="RM" />
<TextBlock Style="{StaticResource HintDataItemsStyle}" Text="{Binding SeriesName, StringFormat='{}{0}:'}" />
<TextBlock Style="{StaticResource HintDataItemsStyle}" Text="{Binding FormattedYValue}" />
</StackPanel>
</DataTemplate>
<DataTemplate x:Key="RolloverTooltipTemplate2" DataType="s:SeriesInfo">
<StackPanel Orientation="Vertical">
<TextBlock Style="{StaticResource HintDataItemsStyle}" Text="{Binding FormattedYValue}" />
<TextBlock Style="{StaticResource HintDataItemsStyle}" Text="{Binding SeriesName, StringFormat='{}{0}:'}" />
<TextBlock Style="{StaticResource HintDataItemsStyle}" Text="RM" />
</StackPanel>
</DataTemplate>
<DataTemplate x:Key="VerticalSliceTooltipTemplate1" DataType="s:SeriesInfo">
<StackPanel Orientation="Vertical">
<TextBlock Style="{StaticResource HintDataItemsStyle}" Text="VCM" />
<TextBlock Style="{StaticResource HintDataItemsStyle}" Text="{Binding SeriesName, StringFormat='{}{0}:'}" />
<TextBlock Style="{StaticResource HintDataItemsStyle}" Text="{Binding FormattedYValue}" />
</StackPanel>
</DataTemplate>
<DataTemplate x:Key="VerticalSliceTooltipTemplate2" DataType="s:SeriesInfo">
<StackPanel Orientation="Vertical">
<TextBlock Style="{StaticResource HintDataItemsStyle}" Text="{Binding FormattedYValue}" />
<TextBlock Style="{StaticResource HintDataItemsStyle}" Text="{Binding SeriesName, StringFormat='{}{0}:'}" />
<TextBlock Style="{StaticResource HintDataItemsStyle}" Text="VCM" />
</StackPanel>
</DataTemplate>
<DataTemplate x:Key="TooltipTemplate1" DataType="s:SeriesInfo">
<StackPanel Orientation="Vertical">
<TextBlock Style="{StaticResource HintDataItemsStyle}" Text="{Binding SeriesName}" />
<TextBlock Style="{StaticResource HintDataItemsStyle}" Text="{Binding FormattedYValue, StringFormat='{}Y : {0}'}" />
<TextBlock Style="{StaticResource HintDataItemsStyle}" Text="{Binding FormattedXValue, StringFormat='{}X : {0}'}" />
</StackPanel>
</DataTemplate>
<DataTemplate x:Key="TooltipTemplate2" DataType="s:SeriesInfo">
<StackPanel Orientation="Vertical">
<TextBlock Style="{StaticResource HintDataItemsStyle}" Text="{Binding FormattedXValue, StringFormat='{}X : {0}'}" />
<TextBlock Style="{StaticResource HintDataItemsStyle}" Text="{Binding FormattedYValue, StringFormat='{}Y : {0}'}" />
<TextBlock Style="{StaticResource HintDataItemsStyle}" Text="{Binding SeriesName}" />
</StackPanel>
</DataTemplate>
<DataTemplate x:Key="CursorTooltipTemplate1" DataType="s:SeriesInfo">
<StackPanel Orientation="Horizontal">
<TextBlock Style="{StaticResource HintDataItemsStyle}" Text="{Binding SeriesName, StringFormat='{}{0} - '}" />
<TextBlock Style="{StaticResource HintDataItemsStyle}" Text="{Binding FormattedYValue, StringFormat='{}Y : {0}'}" />
<TextBlock Style="{StaticResource HintDataItemsStyle}" Text="{Binding FormattedXValue, StringFormat='{}X : {0}'}" />
</StackPanel>
</DataTemplate>
<DataTemplate x:Key="CursorTooltipTemplate2" DataType="s:SeriesInfo">
<StackPanel Orientation="Horizontal">
<TextBlock Style="{StaticResource HintDataItemsStyle}" Text="{Binding SeriesName, StringFormat='{}{0} - '}" />
<TextBlock Style="{StaticResource HintDataItemsStyle}" Text="{Binding FormattedXValue, StringFormat='{}X : {0}'}" />
<TextBlock Style="{StaticResource HintDataItemsStyle}" Text="{Binding FormattedYValue, StringFormat='{}Y : {0}'}" />
</StackPanel>
</DataTemplate>
<Style x:Key="AxisLabelStyle" TargetType="s:AxisLabelControl">
<Setter Property="Background" Value="CornflowerBlue" />
<Setter Property="BorderBrush" Value="Blue" />
</Style>
<DataTemplate x:Key="AxisLabelTemplate" DataType="s:AxisInfo">
<StackPanel>
<TextBlock Style="{StaticResource HintDataItemsStyle}" Text="{Binding AxisId, StringFormat='{}AxisId : {0}'}" />
<TextBlock Style="{StaticResource HintDataItemsStyle}" Text="{Binding DataValue, StringFormat='{}Val : {0}'}" />
</StackPanel>
</DataTemplate>
</UserControl.Resources>
<Grid>
<Grid.ColumnDefinitions>
<ColumnDefinition Width="Auto" />
<ColumnDefinition Width="*" />
</Grid.ColumnDefinitions>
<ext:SciChartInteractionToolbar TargetSurface="{Binding Source={x:Reference Name=SciChart}}" />
<s:SciChartSurface Name="SciChart" Grid.Column="1">
<s:SciChartSurface.RenderableSeries>
<s:FastLineRenderableSeries Stroke="#ff6495ed"
StrokeThickness="2"
s:CursorModifier.TooltipTemplate="{StaticResource CursorTooltipTemplate1}"
s:RolloverModifier.TooltipContainerStyle="{StaticResource TooltipStyle1}"
s:RolloverModifier.TooltipTemplate="{StaticResource RolloverTooltipTemplate1}"
s:TooltipModifier.TooltipContainerStyle="{StaticResource TooltipStyle1}"
s:TooltipModifier.TooltipTemplate="{StaticResource TooltipTemplate1}"
s:VerticalSliceModifier.TooltipContainerStyle="{StaticResource TooltipStyle1}"
s:VerticalSliceModifier.TooltipTemplate="{StaticResource VerticalSliceTooltipTemplate1}" />
<s:FastLineRenderableSeries Stroke="#ffe2460c"
StrokeThickness="2"
s:CursorModifier.TooltipTemplate="{StaticResource CursorTooltipTemplate2}"
s:RolloverModifier.TooltipContainerStyle="{StaticResource TooltipStyle2}"
s:RolloverModifier.TooltipTemplate="{StaticResource RolloverTooltipTemplate2}"
s:TooltipModifier.TooltipContainerStyle="{StaticResource TooltipStyle2}"
s:TooltipModifier.TooltipTemplate="{StaticResource TooltipTemplate2}"
s:VerticalSliceModifier.TooltipContainerStyle="{StaticResource TooltipStyle2}"
s:VerticalSliceModifier.TooltipTemplate="{StaticResource VerticalSliceTooltipTemplate2}" />
</s:SciChartSurface.RenderableSeries>
<s:SciChartSurface.XAxes>
<s:NumericAxis s:RolloverModifier.AxisLabelContainerStyle="{StaticResource AxisLabelStyle}"
s:RolloverModifier.AxisLabelTemplate="{StaticResource AxisLabelTemplate}"
s:CursorModifier.AxisLabelContainerStyle="{StaticResource CursorAxisLabelStyle}"/>
</s:SciChartSurface.XAxes>
<s:SciChartSurface.YAxes>
<s:NumericAxis GrowBy="0.05, 0.05" />
</s:SciChartSurface.YAxes>
<s:SciChartSurface.ChartModifier>
<s:ModifierGroup>
<s:RolloverModifier x:Name="RolloverModifier"
IsEnabled="True"
ShowTooltipOn="Always" />
<s:CursorModifier x:Name="CursorModifier"
TooltipContainerStyle="{StaticResource CursorTooltipStyle}"
IsEnabled="False"
LineOverlayStyle="{StaticResource CursorLineStyle}"
ShowAxisLabels="False"
ShowTooltip="True"
ShowTooltipOn="MouseOver"/>
<s:TooltipModifier x:Name="TooltipModifier" IsEnabled="False" />
<s:VerticalSliceModifier IsEnabled="True">
<s:VerticalSliceModifier.VerticalLines>
<s:VerticalLineAnnotation IsEditable="True"
LabelPlacement="Axis"
ShowLabel="True"
X1="1250" />
</s:VerticalSliceModifier.VerticalLines>
</s:VerticalSliceModifier>
</s:ModifierGroup>
</s:SciChartSurface.ChartModifier>
</s:SciChartSurface>
</Grid>
</UserControl>
// *************************************************************************************
// SCICHART® Copyright SciChart Ltd. 2011-2021. All rights reserved.
//
// Web: http://www.scichart.com
// Support: support@scichart.com
// Sales: sales@scichart.com
//
// CustomTooltipsWithModifiers.xaml.cs is part of the SCICHART® Examples. Permission is hereby granted
// to modify, create derivative works, distribute and publish any part of this source
// code whether for commercial, private or personal use.
//
// The SCICHART® examples are distributed in the hope that they will be useful, but
// without any warranty. It is provided "AS IS" without warranty of any kind, either
// expressed or implied.
// *************************************************************************************
using System;
using System.Windows;
using System.Windows.Controls;
using SciChart.Charting.Model.DataSeries;
namespace SciChart.Examples.Examples.InspectDatapoints
{
/// <summary>
/// Interaction logic for CustomTooltipsWithModifiers.xaml
/// </summary>
public partial class CustomTooltipsWithModifiers : UserControl
{
private readonly Random _random = new Random(251916);
const int Count = 2000;
public CustomTooltipsWithModifiers()
{
Loaded += CustomTooltipsLoaded;
InitializeComponent();
}
private void CustomTooltipsLoaded(object sender, RoutedEventArgs e)
{
// Batch updates with one redraw
using (SciChart.SuspendUpdates())
{
// Add four data-series
var dataSeries0 = new XyDataSeries<double, double>();
var dataSeries1 = new XyDataSeries<double, double>();
SciChart.RenderableSeries[0].DataSeries = FillData(dataSeries0, "Series #1");
SciChart.RenderableSeries[1].DataSeries = FillData(dataSeries1, "Series #2");
}
}
private IDataSeries FillData(IXyDataSeries<double, double> dataSeries, string name)
{
var randomWalk = 10.0;
// Generate the X,Y data with sequential dates on the X-Axis and slightly positively biased random walk on the Y-Axis
var xBuffer = new double[Count];
var yBuffer = new double[Count];
for (int i = 0; i < Count; i++)
{
randomWalk += (_random.NextDouble() - 0.498);
yBuffer[i] = randomWalk;
xBuffer[i] = i;
}
// Buffer above and append all in one go to avoid multiple recalculations of series range
dataSeries.Append(xBuffer, yBuffer);
dataSeries.SeriesName = name;
return dataSeries;
}
}
}