
WPF 3D Radiation Pattern Chart
The WPF 3D Radiation Pattern Chart combines SciChart 3D and 2D chart surfaces in a single view to visualize antenna directivity for radio frequency (RF) engineering. The gain function combines a cos²(theta) element factor with an 8×8 rectangular array factor (half-wavelength spacing, broadside steering).
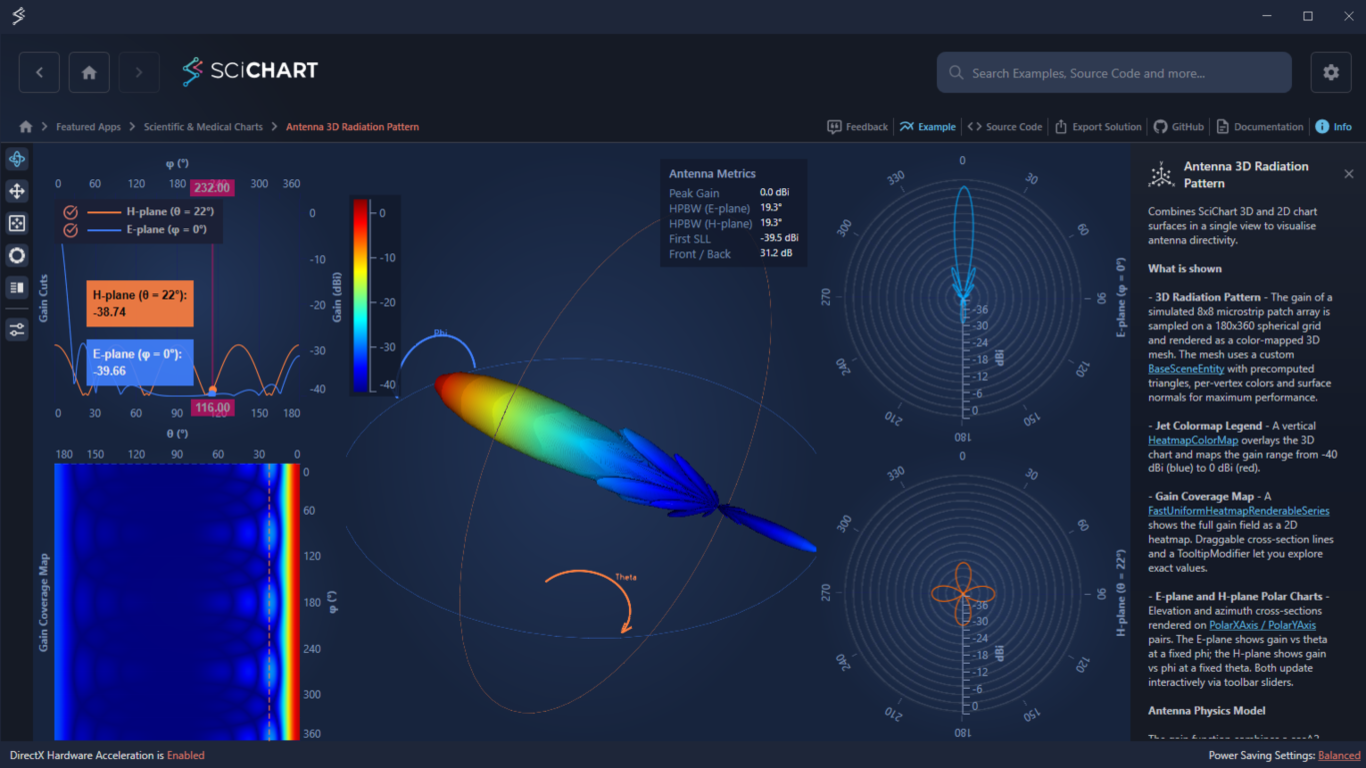
What is Shown
- 3D Radiation Pattern: Gain of a simulated 8×8 microstrip patch array on a 180×360 spherical grid, rendered as a color-mapped 3D mesh using a custom BaseSceneEntity with per-vertex colors and surface normals.
- Jet Colormap Legend: A vertical ColorMap control that maps the gain range to color.
- Gain Coverage Map: A 2D heatmap with draggable cross-section line annotations and a tooltip.
- E-plane and H-plane Polar Charts: Elevation and Azimuth cross-sections, updating interactively via toolbar sliders.
Key Features of the Antenna Radiation Pattern Chart in WPF
- Custom 3D geometry via BaseSceneEntity with per-vertex color and lighting
- Synchronized interactions between 2D and 3D charts
- 2D projections of 3D antenna patterns — Polar and Cartesian, including a Gain Coverage Heatmap
- Interactive Theta and Phi cross-sections
- Configurable indicators with toolbar controls
- Custom Legend and Tooltips
Try the Example
Give the c# Antenna Radiation Pattern demo a try for yourself today. You can view the documentation or head straight to GitHub via the source code.
The C#/WPF source code for this example is included below.
Download the 3D Polar Radiation Chart WPF demo or begin your free trial today to build high-performance WPF charts for design, test, and emulation applications.
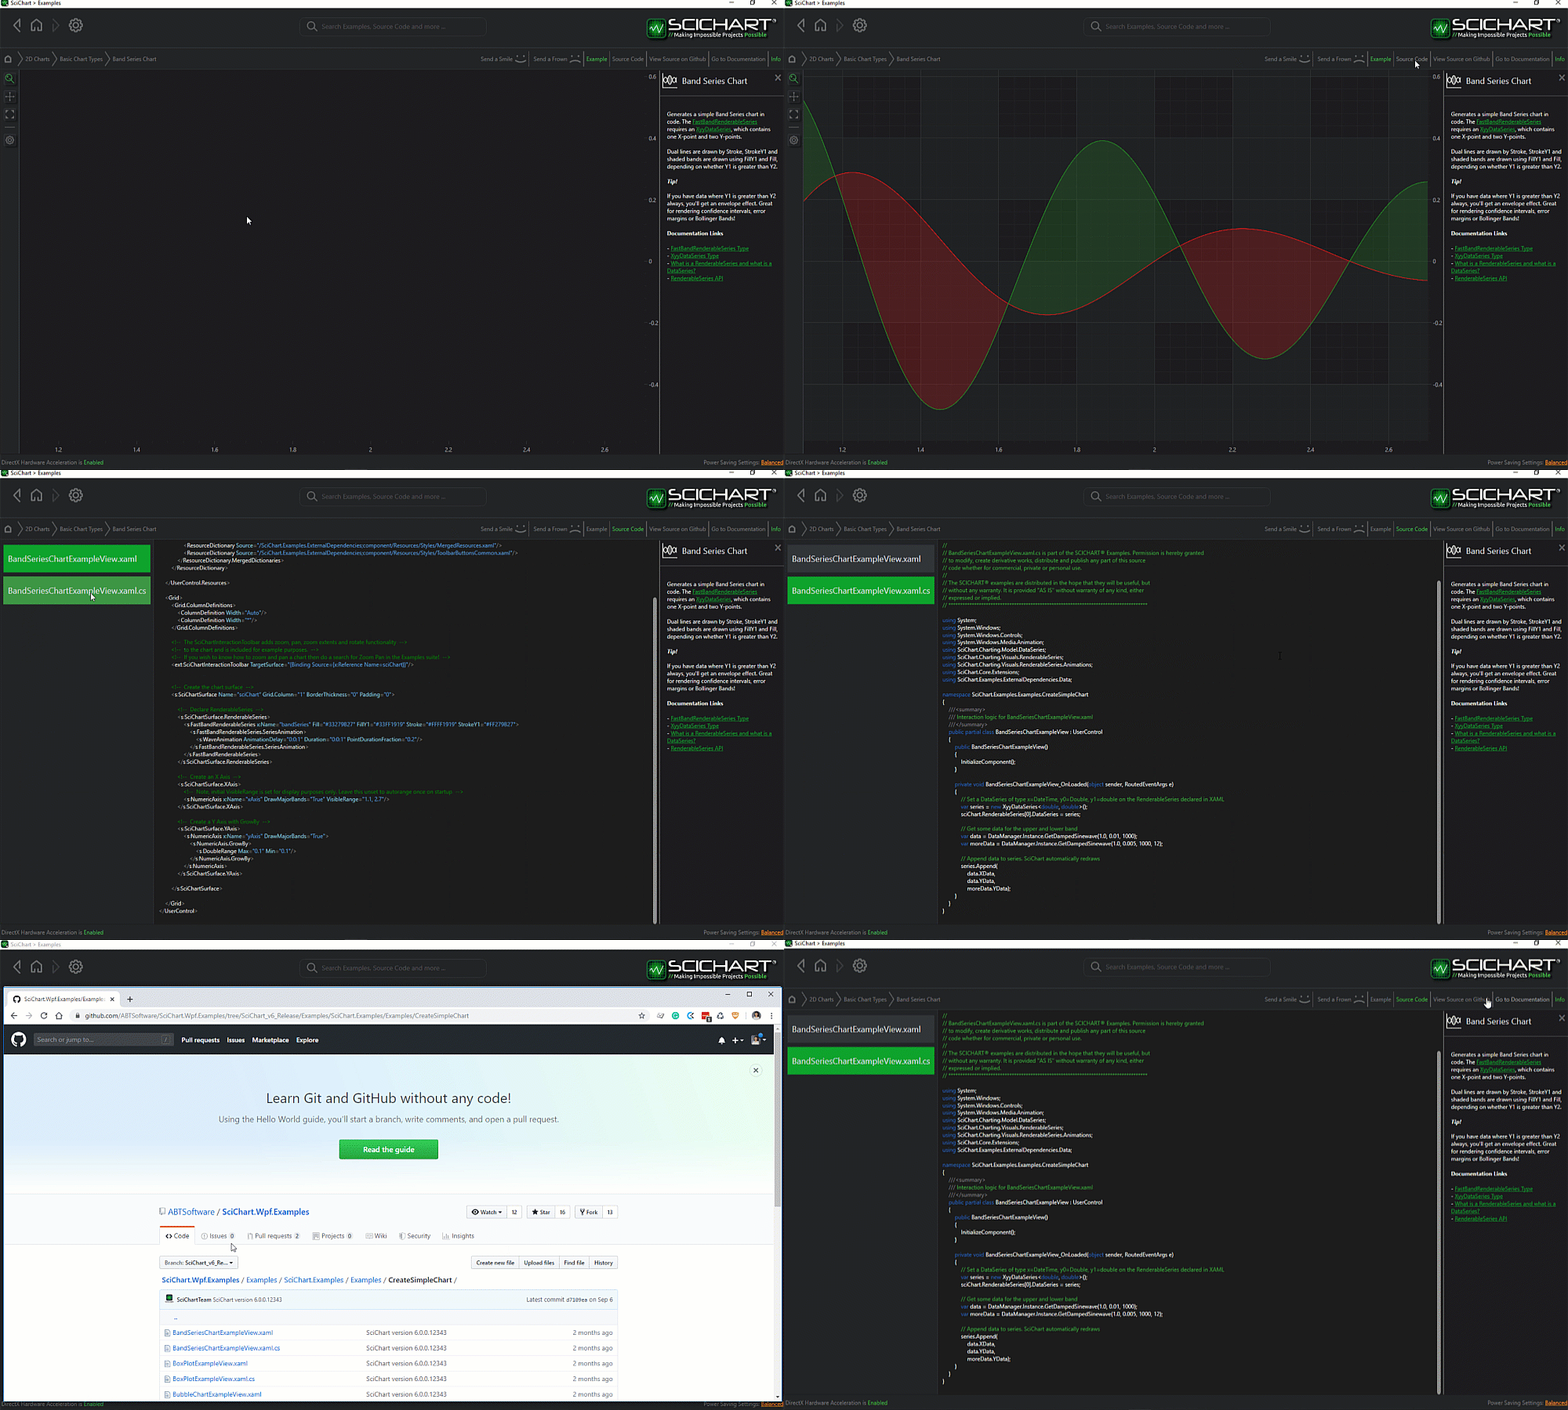
The C#/WPF source code for the WPF 3D Radiation Pattern Chart example is included below (Scroll down!).
Did you know you can also view the source code from one of the following sources as well?
- Clone the SciChart.WPF.Examples from GitHub.
- Or, view source in the SciChart WPF Examples suite.
- Also the SciChart WPF Trial contains the full source for the examples (link below).
Antenna3DRadiationPatternView.xaml
View source code<UserControl x:Class="SciChart.Examples.Examples.SeeFeaturedApplication.Antenna3DRadiationPattern.Antenna3DRadiationPatternView" xmlns="http://schemas.microsoft.com/winfx/2006/xaml/presentation" xmlns:x="http://schemas.microsoft.com/winfx/2006/xaml" xmlns:ext="http://schemas.abtsoftware.co.uk/scichart/exampleExternals" xmlns:s="http://schemas.abtsoftware.co.uk/scichart" xmlns:s3D="http://schemas.abtsoftware.co.uk/scichart3D" xmlns:local="clr-namespace:SciChart.Examples.Examples.SeeFeaturedApplication.Antenna3DRadiationPattern" xmlns:sys="clr-namespace:System;assembly=mscorlib">
<UserControl.Resources>
<ResourceDictionary>
<ResourceDictionary.MergedDictionaries>
<!-- Shared gain color palette and axis styles used across all sub-views -->
<ResourceDictionary Source="AntennaSharedResources.xaml" />
</ResourceDictionary.MergedDictionaries>
<!-- Antenna metrics model: scalar figures-of-merit bound into the legend panel -->
<local:AntennaMetrics x:Key="AntennaMetrics" />
<s:GradientStopsToLinearGradientBrushConverter x:Key="ColorsToLinearGradientBrushConverter" />
<!-- Style for the vertical color bar axis alongside the 3D chart -->
<Style x:Key="ColorBarAxisStyle" TargetType="s:AxisBase">
<Setter Property="BorderThickness" Value="1,0,0,0" />
<Setter Property="BorderBrush" Value="#93A3C5" />
<Setter Property="DrawMinorTicks" Value="False" />
<Setter Property="AutoTicks" Value="False" />
<Setter Property="AxisAlignment" Value="Right" />
<Setter Property="MajorDelta">
<Setter.Value>
<sys:Double>10</sys:Double>
</Setter.Value>
</Setter>
<Setter Property="MajorTickLineStyle" Value="{StaticResource AxisTickStyle}" />
</Style>
<!-- Custom legend template: displays antenna metrics (peak gain, HPBW, SLL, F/B ratio) -->
<ControlTemplate x:Key="LegendTemplate">
<Border HorizontalAlignment="Right" VerticalAlignment="Top" Margin="0,10,10,0" Background="#CC11192C" BorderBrush="#4493A3C5" BorderThickness="0" Padding="10,7">
<StackPanel>
<TextBlock Text="Antenna Metrics" Foreground="#93A3C5" FontSize="13" FontWeight="SemiBold" Margin="0,0,0,5" />
<Grid>
<Grid.ColumnDefinitions>
<ColumnDefinition Width="Auto" />
<ColumnDefinition Width="8" />
<ColumnDefinition Width="Auto" />
</Grid.ColumnDefinitions>
<Grid.RowDefinitions>
<RowDefinition />
<RowDefinition />
<RowDefinition />
<RowDefinition />
<RowDefinition />
</Grid.RowDefinitions>
<TextBlock Grid.Row="0" Grid.Column="0" Text="Peak Gain" Foreground="#7088AA" FontSize="13" />
<TextBlock Grid.Row="1" Grid.Column="0" Text="HPBW (E-plane)" Foreground="#7088AA" FontSize="13" />
<TextBlock Grid.Row="2" Grid.Column="0" Text="HPBW (H-plane)" Foreground="#7088AA" FontSize="13" />
<TextBlock Grid.Row="3" Grid.Column="0" Text="First SLL" Foreground="#7088AA" FontSize="13" />
<TextBlock Grid.Row="4" Grid.Column="0" Text="Front / Back" Foreground="#7088AA" FontSize="13" />
<TextBlock Grid.Row="0" Grid.Column="2" FontSize="11" Foreground="#E0FFFFFF" Text="{Binding PeakGain, Mode=OneWay, Source={StaticResource AntennaMetrics}}" />
<TextBlock Grid.Row="1" Grid.Column="2" FontSize="11" Foreground="#E0FFFFFF" Text="{Binding HpbwEPlane, Mode=OneWay, Source={StaticResource AntennaMetrics}}" />
<TextBlock Grid.Row="2" Grid.Column="2" FontSize="11" Foreground="#E0FFFFFF" Text="{Binding HpbwHPlane, Mode=OneWay, Source={StaticResource AntennaMetrics}}" />
<TextBlock Grid.Row="3" Grid.Column="2" FontSize="11" Foreground="#E0FFFFFF" Text="{Binding FirstSll, Mode=OneWay, Source={StaticResource AntennaMetrics}}" />
<TextBlock Grid.Row="4" Grid.Column="2" FontSize="11" Foreground="#E0FFFFFF" Text="{Binding FrontToBack, Mode=OneWay, Source={StaticResource AntennaMetrics}}" />
</Grid>
</StackPanel>
</Border>
</ControlTemplate>
</ResourceDictionary>
</UserControl.Resources>
<!-- Layout: toolbar | gain coverage (left) | 3D chart (centre) | polar charts (right) -->
<Grid Background="{StaticResource ThemedSurfaceChartBackground}">
<Grid.ColumnDefinitions>
<ColumnDefinition Width="Auto" />
<ColumnDefinition Width="2*" />
<ColumnDefinition Width="3*" />
<ColumnDefinition Width="2*" />
</Grid.ColumnDefinitions>
<Grid.RowDefinitions>
<RowDefinition Height="*" />
<RowDefinition Height="*" />
</Grid.RowDefinitions>
<!-- Toolbar with cross-section angle sliders and visual settings -->
<ext:SciChart3DInteractionToolbar Grid.Column="0" Grid.Row="0" Grid.RowSpan="2" TargetSurface="{Binding Source={x:Reference Name=sciChart}}">
<ext:FlyoutSeparator />
<ext:FlyoutMenuButton ToolTipService.ToolTip="Cross-section settings">
<ext:ToolbarIcon Kind="TuneVariant" Height="16" Width="16" Style="{StaticResource ToolbarButtonIconStyle}" />
<ext:FlyoutMenuButton.PopupContent>
<StackPanel Margin="5" MinWidth="200" Orientation="Vertical">
<!-- E-plane cut: selects φ angle for the elevation cross-section -->
<TextBlock Text="E-plane φ cut" Style="{StaticResource FlyoutMenuHeaderStyle}" />
<StackPanel Orientation="Horizontal">
<Slider x:Name="PhiCutSlider" Width="130" VerticalAlignment="Center" Minimum="0" Maximum="360" Value="0" IsSnapToTickEnabled="True" TickFrequency="1" ValueChanged="OnPhiCutChanged" />
<TextBlock Text="{Binding Source={x:Reference PhiCutSlider}, Path=Value, StringFormat={}{0:F0}°}" VerticalAlignment="Center" Margin="6,0,0,0" />
</StackPanel>
<!-- H-plane cut: selects θ angle for the azimuth cross-section -->
<TextBlock Text="H-plane θ cut" Margin="0,10,0,4" Style="{StaticResource FlyoutMenuHeaderStyle}" />
<StackPanel Orientation="Horizontal">
<Slider x:Name="ThetaCutSlider" Width="130" VerticalAlignment="Center" Minimum="0" Maximum="180" Value="22" IsSnapToTickEnabled="True" TickFrequency="1" ValueChanged="OnThetaCutChanged" />
<TextBlock Text="{Binding Source={x:Reference ThetaCutSlider}, Path=Value, StringFormat={}{0:F0}°}" VerticalAlignment="Center" Margin="6,0,0,0" />
</StackPanel>
<!-- Ring opacity: controls visibility of θ/φ rings on the 3D mesh -->
<TextBlock Text="Ring opacity" Margin="0,10,0,4" Style="{StaticResource FlyoutMenuHeaderStyle}" />
<StackPanel Orientation="Horizontal">
<Slider x:Name="OverlayOpacitySlider" Width="130" HorizontalAlignment="Left" Minimum="0" Maximum="1" Value="0.4" />
<TextBlock Text="{Binding Source={x:Reference OverlayOpacitySlider}, Path=Value, StringFormat={}{0:0.0}}" VerticalAlignment="Center" Margin="6,0,0,0" />
</StackPanel>
<!-- Indicator opacity: controls visibility of θ/φ arc indicators -->
<TextBlock Text="Indicator opacity" Margin="0,10,0,4" Style="{StaticResource FlyoutMenuHeaderStyle}" />
<StackPanel Orientation="Horizontal">
<Slider x:Name="IndicatorOpacitySlider" Width="130" HorizontalAlignment="Left" Minimum="0" Maximum="1" Value="1.0" ValueChanged="OnIndicatorOpacityChanged" />
<TextBlock Text="{Binding Source={x:Reference IndicatorOpacitySlider}, Path=Value, StringFormat={}{0:0.0}}" VerticalAlignment="Center" Margin="6,0,0,0" />
</StackPanel>
<!-- Indicator radius: scales the size of the θ/φ arc indicators -->
<TextBlock Text="Indicator radius" Margin="0,10,0,4" Style="{StaticResource FlyoutMenuHeaderStyle}" />
<StackPanel Orientation="Horizontal">
<Slider x:Name="IndicatorRadiusSlider" Width="130" HorizontalAlignment="Left" Minimum="0.5" Maximum="3.5" Value="0.8" ValueChanged="OnIndicatorRadiusChanged" />
<TextBlock Text="{Binding Source={x:Reference IndicatorRadiusSlider}, Path=Value, StringFormat={}{0:0.0}}" VerticalAlignment="Center" Margin="6,0,0,0" />
</StackPanel>
</StackPanel>
</ext:FlyoutMenuButton.PopupContent>
</ext:FlyoutMenuButton>
</ext:SciChart3DInteractionToolbar>
<!-- Left panel: gain cut lines (fan chart) and gain coverage heatmap -->
<local:GainCoverageChartsView x:Name="gainCoverageView" Grid.Column="1" Grid.Row="0" Grid.RowSpan="2" />
<!-- Centre: 3D radiation pattern with gain mesh, coordinate rings and angle indicators -->
<s3D:SciChart3DSurface x:Name="sciChart"
Grid.Column="2" Grid.Row="0" Grid.RowSpan="2"
Margin="0,8,0,0"
WorldDimensions="200,200,200"
BorderThickness="0"
IsFpsCounterVisible="False"
IsXyzGizmoVisible="False"
s3D:XyAxisPlane.IsPlaneVisible="False"
s3D:ZyAxisPlane.IsPlaneVisible="False"
s3D:ZxAxisPlane.IsPlaneVisible="False">
<s3D:SciChart3DSurface.Camera>
<s3D:Camera3D Position="-142,215,-120" Target="0,100,0" />
</s3D:SciChart3DSurface.Camera>
<s3D:SciChart3DSurface.RenderableSeries>
<!-- Coordinate rings on the 3D mesh, showing the current θ and φ cut planes -->
<s3D:PointLineRenderableSeries3D x:Name="phiRing" Stroke="#FF4080FF" StrokeThickness="1" IsAntialiased="True" Opacity="{Binding Source={x:Reference OverlayOpacitySlider}, Path=Value}" />
<s3D:PointLineRenderableSeries3D x:Name="thetaRing" Stroke="#FFFF8040" StrokeThickness="1" IsAntialiased="True" Opacity="{Binding Source={x:Reference OverlayOpacitySlider}, Path=Value}" />
<!-- Angle indicators: arcs with arrowheads showing θ and φ directions -->
<s3D:PointLineRenderableSeries3D x:Name="thetaArc" Stroke="#FFFF8040" StrokeThickness="3" IsAntialiased="True" Opacity="{Binding Source={x:Reference IndicatorOpacitySlider}, Path=Value}" />
<s3D:PointLineRenderableSeries3D x:Name="thetaArrow" Stroke="#FFFF8040" StrokeThickness="3" IsAntialiased="True" Opacity="{Binding Source={x:Reference IndicatorOpacitySlider}, Path=Value}" />
<s3D:PointLineRenderableSeries3D x:Name="phiArc" Stroke="#FF4080FF" StrokeThickness="3" IsAntialiased="True" Opacity="{Binding Source={x:Reference IndicatorOpacitySlider}, Path=Value}" />
<s3D:PointLineRenderableSeries3D x:Name="phiArrow" Stroke="#FF4080FF" StrokeThickness="3" IsAntialiased="True" Opacity="{Binding Source={x:Reference IndicatorOpacitySlider}, Path=Value}" />
</s3D:SciChart3DSurface.RenderableSeries>
<!-- Axes use manual ranges set in code-behind to fit the mesh extents -->
<s3D:SciChart3DSurface.XAxis>
<s3D:NumericAxis3D AutoRange="Never" VisibleRange="-5.5,5.5" />
</s3D:SciChart3DSurface.XAxis>
<s3D:SciChart3DSurface.YAxis>
<s3D:NumericAxis3D AutoRange="Never" />
</s3D:SciChart3DSurface.YAxis>
<s3D:SciChart3DSurface.ZAxis>
<s3D:NumericAxis3D AutoRange="Never" VisibleRange="-5.5,5.5" />
</s3D:SciChart3DSurface.ZAxis>
<!-- Chart modifiers: orbit, zoom, zoom-extents reset, and the metrics legend -->
<s3D:SciChart3DSurface.ChartModifier>
<s3D:ModifierGroup3D>
<s3D:MouseWheelZoomModifier3D />
<s3D:OrbitModifier3D />
<s3D:ZoomExtentsModifier3D AnimateDurationMs="500" ResetPosition="-142,215,-120" ResetTarget="0,100,0" />
<s3D:LegendModifier3D ShowLegend="True" LegendPlacement="Inside" HorizontalAlignment="Right" LegendTemplate="{StaticResource LegendTemplate}" />
</s3D:ModifierGroup3D>
</s3D:SciChart3DSurface.ChartModifier>
</s3D:SciChart3DSurface>
<!-- Right panel: E-plane and H-plane polar gain cuts -->
<local:PolarChartsView x:Name="polarView" Grid.Column="3" Grid.Row="0" Grid.RowSpan="2" />
<!-- Vertical color bar: maps the shared gain palette to dBi values -->
<s:HeatmapColorMap Grid.Column="2"
Grid.Row="0"
Margin="3,58.2,0,51.2"
Padding="5"
EnableAxisDrag="False"
HorizontalAlignment="Left"
VerticalAlignment="Stretch"
BorderThickness="0"
Background="{StaticResource ThemedTransparentChartBackground}"
ColorMap="{Binding Source={StaticResource GainColorPalette}, Path=GradientStops, Converter={StaticResource ColorsToLinearGradientBrushConverter}}"
Minimum="{Binding Source={StaticResource GainColorPalette}, Path=Minimum}"
Maximum="{Binding Source={StaticResource GainColorPalette}, Path=Maximum}"
Orientation="Vertical"
TextFormatting="0"
AxisStyle="{StaticResource ColorBarAxisStyle}" />
</Grid>
</UserControl>
Antenna3DRadiationPatternView.xaml.cs
View source code// *************************************************************************************
// SCICHART® Copyright SciChart Ltd. 2011-2026. All rights reserved.
//
// Web: http://www.scichart.com
// Support: support@scichart.com
// Sales: sales@scichart.com
//
// Antenna3DRadiationPatternView.xaml.cs is part of the SCICHART® Examples. Permission is hereby granted
// to modify, create derivative works, distribute and publish any part of this source
// code whether for commercial, private or personal use.
//
// The SCICHART® examples are distributed in the hope that they will be useful, but
// without any warranty. It is provided "AS IS" without warranty of any kind, either
// expressed or implied.
// *************************************************************************************
using SciChart.Charting.Common.MarkupExtensions;
using SciChart.Charting.Visuals.RenderableSeries;
using SciChart.Charting3D;
using SciChart.Charting3D.Interop;
using System;
using System.Windows;
using System.Windows.Controls;
using System.Windows.Media;
using SciChart.Charting3D.Model;
using SciChart.Data.Model;
using SciChart.Examples.Examples.Charts3D.Customize3DChart.AddGeometry3D;
using Viewport3D = SciChart.Charting3D.Viewport3D;
namespace SciChart.Examples.Examples.SeeFeaturedApplication.Antenna3DRadiationPattern
{
/// <summary>
/// Main view for the Antenna 3D Radiation Pattern example.
///
/// Layout: toolbar | gain coverage charts (left) | 3D chart (centre) | polar charts (right).
///
/// The 3D chart renders a closed triangulated mesh of the antenna gain pattern
/// (AntennaGainMeshEntity) with interactive θ/φ coordinate rings and angle
/// indicators. The side panels show synchronised 2D cross-sections:
/// - GainCoverageChartsView: E/H-plane gain cut lines + φ×θ heatmap
/// - PolarChartsView: E-plane and H-plane polar plots
/// </summary>
public partial class Antenna3DRadiationPatternView : UserControl
{
private const int ThetaCount = 180;
private const int PhiCount = 360;
private const double Scale = 5.0;
private const int MeshLodStep = 2;
private const int RingSteps = 72;
private const double InitialPhiDeg = 0.0;
private const double InitialThetaDeg = 22.0;
private Viewport3DOrientation _defaultOrientation;
private double[,] _gain;
private double _ringRadius;
private double _ringCenterY;
private TextSceneEntity _thetaLabel;
private TextSceneEntity _phiLabel;
private Color _thetaLabelColor;
private Color _phiLabelColor;
public Antenna3DRadiationPatternView()
{
InitializeComponent();
Loaded += OnLoaded;
Unloaded += OnUnloaded;
}
private void OnUnloaded(object sender, RoutedEventArgs e)
{
Viewport3D.SetViewportOrientation(_defaultOrientation);
}
private void OnLoaded(object _, RoutedEventArgs __)
{
// Disable shadow effects for tooltips
EffectManager.EnableDropShadows = false;
// Save the used Viewport orientation before the Example is initialized
_defaultOrientation = Viewport3D.ViewportOrientation;
Viewport3D.SetViewportOrientation(Viewport3DOrientation.ZAxisUp);
// Set up the example
double thetaStepDeg = 180.0 / (ThetaCount - 1);
double phiStepDeg = 360.0 / PhiCount;
double thetaStepRad = AntennaMetrics.ToRadians(thetaStepDeg);
double phiStepRad = AntennaMetrics.ToRadians(phiStepDeg);
// 1. Generate gain data — normalised [0,1] pattern for each (θ, φ) sample
var gain = new double[ThetaCount, PhiCount];
for (int ti = 0; ti < ThetaCount; ti++)
for (int pi = 0; pi < PhiCount; pi++)
gain[ti, pi] = AntennaGain(ti * thetaStepRad, pi * phiStepRad);
_gain = gain;
// Subsample for the 3D mesh to reduce triangle count (~32K vs ~129K)
int meshThetaCount = (ThetaCount - 1) / MeshLodStep + 1;
int meshPhiCount = PhiCount / MeshLodStep;
var meshGain = new double[meshThetaCount, meshPhiCount];
for (int ti = 0; ti < meshThetaCount; ti++)
for (int pi = 0; pi < meshPhiCount; pi++)
meshGain[ti, pi] = gain[ti * MeshLodStep, pi * MeshLodStep];
// Use the shared HeatmapColorPalette from XAML for consistent coloring
var palette = (HeatmapColorPalette)FindResource("GainColorPalette");
palette.InitializeColorMap(typeof(object), 1.0);
var meshEntity = new AntennaGainMeshEntity(meshGain, meshThetaCount, meshPhiCount, Scale, palette);
// Ring geometry is derived from the mesh bounding box
_ringRadius = (meshEntity.MaxY - meshEntity.MinY) / 2.0;
_ringCenterY = (meshEntity.MinY + meshEntity.MaxY) / 2.0;
// 2. Populate chart views
sciChart.Viewport3D.RootEntity.Children.Add(meshEntity);
gainCoverageView.Populate(gain, thetaStepDeg, phiStepDeg, InitialThetaDeg, InitialPhiDeg);
gainCoverageView.BindSliders(ThetaCutSlider, PhiCutSlider);
polarView.Populate(gain, thetaStepDeg, phiStepDeg, InitialThetaDeg, InitialPhiDeg);
// 3. Build rings, angle indicators and metrics
BuildPhiRing(InitialPhiDeg, _ringRadius, _ringCenterY);
BuildThetaRing(InitialThetaDeg, gain, _ringRadius);
BuildAngleIndicators(_ringRadius, _ringCenterY);
var metrics = (AntennaMetrics)Resources["AntennaMetrics"];
PopulateMetrics(metrics, gain, thetaStepDeg, phiStepDeg);
// 4. Set visible ranges to tightly fit the mesh with a small padding
double rangePadding = 1.05;
sciChart.YAxis.VisibleRange = new DoubleRange(meshEntity.MinY, meshEntity.MaxY);
var xzRange = new DoubleRange(-_ringRadius * rangePadding, _ringRadius * rangePadding);
sciChart.XAxis.VisibleRange = xzRange;
sciChart.ZAxis.VisibleRange = xzRange;
UpdateAngleIndicators(IndicatorRadiusSlider.Value, _ringRadius, _ringCenterY);
}
/// <summary>
/// Builds a great-circle ring on the 3D mesh at a fixed azimuth angle φ.
/// The ring traces a full circle in the plane defined by φ, tilted from
/// the +Y axis (θ=0) down to -Y (θ=180).
/// </summary>
private void BuildPhiRing(double phiDeg, double ringRadius, double ringCenterY)
{
double phi = AntennaMetrics.ToRadians(phiDeg);
var ds = new XyzDataSeries3D<double, double, double>();
using (ds.SuspendUpdates())
for (int i = 0; i <= RingSteps; i++)
{
double alpha = i * 2.0 * Math.PI / RingSteps;
ds.Append(ringRadius * Math.Sin(alpha) * Math.Cos(phi),
ringCenterY + ringRadius * Math.Cos(alpha),
ringRadius * Math.Sin(alpha) * Math.Sin(phi));
}
phiRing.DataSeries = ds;
}
/// <summary>
/// Builds a horizontal ring on the 3D mesh at a fixed elevation angle θ.
/// The ring Y position follows the average mesh surface at that θ so it
/// sits on (not through) the gain pattern.
/// </summary>
private void BuildThetaRing(double thetaDeg, double[,] gain, double ringRadius)
{
double theta = AntennaMetrics.ToRadians(thetaDeg);
// Ring Y = average mesh vertex Y at this theta: avgGain(θ) * Scale * cos(θ)
int thetaIdx = (int)Math.Round(thetaDeg / 180.0 * (ThetaCount - 1));
thetaIdx = Math.Max(0, Math.Min(thetaIdx, ThetaCount - 1));
double sum = 0;
for (int pi = 0; pi < PhiCount; pi++)
sum += gain[thetaIdx, pi];
double ringY = (sum / PhiCount) * Scale * Math.Cos(theta);
var ds = new XyzDataSeries3D<double, double, double>();
using (ds.SuspendUpdates())
for (int i = 0; i <= RingSteps; i++)
{
double beta = i * 2.0 * Math.PI / RingSteps;
ds.Append(ringRadius * Math.Cos(beta),
ringY,
ringRadius * Math.Sin(beta));
}
thetaRing.DataSeries = ds;
}
/// <summary>
/// Creates the θ and φ angle indicator labels (TextSceneEntity) and
/// triggers the initial arc/arrow layout.
/// </summary>
private void BuildAngleIndicators(double ringRadius, double ringCenterY)
{
_thetaLabelColor = Color.FromRgb(0xFF, 0x80, 0x40);
_phiLabelColor = Color.FromRgb(0x40, 0x80, 0xFF);
_thetaLabel = new TextSceneEntity("Theta", _thetaLabelColor, new Vector3(), 5, "Segoe UI");
sciChart.Viewport3D.RootEntity.Children.Add(_thetaLabel);
_phiLabel = new TextSceneEntity("Phi", _phiLabelColor, new Vector3(), 5, "Segoe UI");
sciChart.Viewport3D.RootEntity.Children.Add(_phiLabel);
UpdateAngleIndicators(IndicatorRadiusSlider.Value, ringRadius, ringCenterY);
}
/// <summary>
/// Redraws the θ and φ angle indicator arcs, arrowheads, and labels.
/// The θ arc is a semicircle on the XY plane (back wall), while the
/// φ arc is a semicircle on the XZ plane (top).
/// </summary>
private void UpdateAngleIndicators(double r, double ringRadius, double ringCenterY)
{
const int arcSteps = 72;
double arrowLength = r * 0.25;
double arrowWingSpread = 0.3;
double rangePadding = 1.05;
double labelOffsetFactor = 1.08;
double zPlane = -ringRadius * rangePadding;
double yPlane = ringCenterY + ringRadius;
// Theta arc: semicircle on XY plane (Z = zPlane), centered at ringCenterY
var thetaArcDs = new XyzDataSeries3D<double, double, double>();
using (thetaArcDs.SuspendUpdates())
for (int i = 0; i <= arcSteps; i++)
{
double alpha = i * Math.PI / arcSteps;
thetaArcDs.Append(r * Math.Sin(alpha), ringCenterY + r * Math.Cos(alpha), zPlane);
}
thetaArc.DataSeries = thetaArcDs;
// Theta arrowhead at bottom of arc, wings spread in X
double thetaTipY = ringCenterY - r;
var thetaArrowDs = new XyzDataSeries3D<double, double, double>();
using (thetaArrowDs.SuspendUpdates())
{
thetaArrowDs.Append(arrowLength, thetaTipY - arrowLength * arrowWingSpread, zPlane);
thetaArrowDs.Append(0, thetaTipY, zPlane);
thetaArrowDs.Append(arrowLength, thetaTipY + arrowLength * arrowWingSpread, zPlane);
}
thetaArrow.DataSeries = thetaArrowDs;
// Phi arc: semicircle on XZ plane (Y = yPlane)
var phiArcDs = new XyzDataSeries3D<double, double, double>();
using (phiArcDs.SuspendUpdates())
for (int i = 0; i <= arcSteps; i++)
{
double beta = i * Math.PI / arcSteps;
phiArcDs.Append(r * Math.Cos(beta), yPlane, r * Math.Sin(beta));
}
phiArc.DataSeries = phiArcDs;
// Phi arrowhead at left end of arc, wings spread in Z
var phiArrowDs = new XyzDataSeries3D<double, double, double>();
using (phiArrowDs.SuspendUpdates())
{
phiArrowDs.Append(-r - arrowLength * arrowWingSpread, yPlane, arrowLength);
phiArrowDs.Append(-r, yPlane, 0);
phiArrowDs.Append(-r + arrowLength * arrowWingSpread, yPlane, arrowLength);
}
phiArrow.DataSeries = phiArrowDs;
// Position labels near arc midpoints
double labelR = r * labelOffsetFactor;
_thetaLabel.Location = TransformToWorldCoordinates(labelR, ringCenterY, zPlane);
_phiLabel.Location = TransformToWorldCoordinates(0, yPlane, labelR);
sciChart.InvalidateElement();
}
private void OnIndicatorRadiusChanged(object sender, RoutedPropertyChangedEventArgs<double> e)
{
if (_gain == null) return;
UpdateAngleIndicators(e.NewValue, _ringRadius, _ringCenterY);
}
/// <summary>
/// Slider changed: update the φ ring on the 3D mesh and both 2D E-plane cuts.
/// </summary>
private void OnPhiCutChanged(object sender, RoutedPropertyChangedEventArgs<double> e)
{
if (_gain == null) return;
BuildPhiRing(e.NewValue, _ringRadius, _ringCenterY);
polarView.UpdateElevationCut(e.NewValue);
gainCoverageView.UpdatePhiCut(e.NewValue);
}
/// <summary>
/// Slider changed: update the θ ring on the 3D mesh and both 2D H-plane cuts.
/// </summary>
private void OnThetaCutChanged(object sender, RoutedPropertyChangedEventArgs<double> e)
{
if (_gain == null) return;
BuildThetaRing(e.NewValue, _gain, _ringRadius);
polarView.UpdateAzimuthCut(e.NewValue);
gainCoverageView.UpdateThetaCut(e.NewValue);
}
private void OnIndicatorOpacityChanged(object sender, RoutedPropertyChangedEventArgs<double> e)
{
if (_thetaLabel == null) return;
byte alpha = (byte)(e.NewValue * 255);
_thetaLabel.TextColor = Color.FromArgb(alpha, _thetaLabelColor.R, _thetaLabelColor.G, _thetaLabelColor.B);
_phiLabel.TextColor = Color.FromArgb(alpha, _phiLabelColor.R, _phiLabelColor.G, _phiLabelColor.B);
sciChart.InvalidateElement();
}
/// <summary>
/// Computes the normalised gain [0,1] for an 8×8 microstrip patch array
/// with λ/2 spacing and broadside steering.
/// Pattern = element_factor(θ) × array_factor(θ,φ)^afExponent.
/// θ ∈ [0,π] from +Y (main beam); φ ∈ [0,2π], φ=0 → +X axis.
/// </summary>
private static double AntennaGain(double theta, double phi)
{
int elementsPerAxis = 8;
int totalElements = elementsPerAxis * elementsPerAxis;
double afExponent = 0.75;
double backLobeAttenuation = 0.22;
double sinT = Math.Sin(theta);
double cosT = Math.Cos(theta);
double psix = Math.PI * sinT * Math.Cos(phi);
double psiy = Math.PI * sinT * Math.Sin(phi);
double af = Math.Pow((SincArrayFactor(psix, elementsPerAxis) * SincArrayFactor(psiy, elementsPerAxis)) / totalElements, afExponent);
double ef = cosT >= 0 ? cosT * cosT : backLobeAttenuation * cosT * cosT;
return ef * af;
}
/// <summary>
/// sin(N·ψ/2) / sin(ψ/2) — the standard uniform linear array factor.
/// Returns N at ψ = 0 (L'Hôpital limit).
/// </summary>
private static double SincArrayFactor(double psi, int n)
{
double halfPsi = psi / 2.0;
double denom = Math.Sin(halfPsi);
if (Math.Abs(denom) < 1e-9) return n;
return Math.Abs(Math.Sin(n * halfPsi) / denom);
}
/// <summary>
/// Computes scalar antenna metrics from the gain grid and writes them
/// into the AntennaMetrics model (bound to the legend panel).
/// </summary>
private static void PopulateMetrics(AntennaMetrics m, double[,] gain,
double thetaStepDeg, double phiStepDeg)
{
int thetaCount = gain.GetLength(0);
int phiCount = gain.GetLength(1);
// Half-power beamwidth in the E-plane (φ = 0° cut)
double hpbwE = ComputeHpbw(gain, thetaCount, phiIdx: 0, thetaStepDeg);
// Half-power beamwidth in the H-plane (φ = 90° cut)
int phiIdx90 = (int)Math.Round(90.0 / phiStepDeg) % phiCount;
double hpbwH = ComputeHpbw(gain, thetaCount, phiIdx: phiIdx90, thetaStepDeg);
// First sidelobe level relative to peak in dBi
double sllDbi = ComputeFirstSllDbi(gain, thetaCount, phiIdx: 0);
// Front-to-back ratio: peak gain (0 dBi) minus gain at θ = 180°
double fbr = 0.0 - AntennaMetrics.ToDbi(gain[thetaCount - 1, 0]);
// Peak gain is 0 dBi by definition (normalised pattern)
m.PeakGain = "0.0 dBi";
m.HpbwEPlane = double.IsNaN(hpbwE) ? "—" : $"{hpbwE:F1}°";
m.HpbwHPlane = double.IsNaN(hpbwH) ? "—" : $"{hpbwH:F1}°";
m.FirstSll = $"{sllDbi:F1} dBi";
m.FrontToBack = $"{fbr:F1} dB";
}
/// <summary>
/// Finds the half-power beamwidth (HPBW) by scanning θ from broadside
/// until the gain drops below half-power, then interpolating.
/// Returns the full (2×) beamwidth in degrees.
/// </summary>
private static double ComputeHpbw(double[,] gain, int thetaCount, int phiIdx, double thetaStepDeg)
{
double peak = gain[0, phiIdx];
double halfPower = peak * 0.5;
for (int ti = 1; ti < thetaCount; ti++)
{
if (gain[ti, phiIdx] < halfPower)
{
double g0 = gain[ti - 1, phiIdx], g1 = gain[ti, phiIdx];
double frac = (halfPower - g0) / (g1 - g0);
return 2.0 * (ti - 1 + frac) * thetaStepDeg;
}
}
return double.NaN;
}
/// <summary>
/// Finds the first sidelobe peak by scanning θ past the main lobe.
/// Returns the sidelobe level in dBi.
/// </summary>
private static double ComputeFirstSllDbi(double[,] gain, int thetaCount, int phiIdx)
{
double mainLobeEndThreshold = 0.1;
double sidelobePeakMinGain = 0.001;
bool mainLobeEnded = false;
double prevG = gain[0, phiIdx];
for (int ti = 1; ti < thetaCount - 1; ti++)
{
double g = gain[ti, phiIdx], gNext = gain[ti + 1, phiIdx];
if (!mainLobeEnded) { if (g < prevG * mainLobeEndThreshold && g < mainLobeEndThreshold) mainLobeEnded = true; }
else if (g > prevG && g > gNext && g > sidelobePeakMinGain) return AntennaMetrics.ToDbi(g);
prevG = g;
}
return -AntennaMetrics.DbiRange;
}
/// <summary>
/// Converts data-space (X,Y,Z) coordinates into 3D world coordinates,
/// accounting for the axis coordinate calculators and world-center offsets.
/// </summary>
private Vector3 TransformToWorldCoordinates(double dataX, double dataY, double dataZ)
{
return new Vector3
{
X = (float)sciChart.XAxis.GetCurrentCoordinateCalculator().GetCoordinate(dataX) - sciChart.WorldDimensions.X / 2.0f,
Y = (float)sciChart.YAxis.GetCurrentCoordinateCalculator().GetCoordinate(dataY),
Z = (float)sciChart.ZAxis.GetCurrentCoordinateCalculator().GetCoordinate(dataZ) - sciChart.WorldDimensions.Z / 2.0f
};
}
}
}
AntennaGainMeshEntity.cs
View source code// *************************************************************************************
// SCICHART® Copyright SciChart Ltd. 2011-2026. All rights reserved.
//
// Web: http://www.scichart.com
// Support: support@scichart.com
// Sales: sales@scichart.com
//
// AntennaGainMeshEntity.cs is part of the SCICHART® Examples. Permission is hereby granted
// to modify, create derivative works, distribute and publish any part of this source
// code whether for commercial, private or personal use.
//
// The SCICHART® examples are distributed in the hope that they will be useful, but
// without any warranty. It is provided "AS IS" without warranty of any kind, either
// expressed or implied.
// *************************************************************************************
using System;
using System.Windows.Media;
using SciChart.Charting.Visuals.RenderableSeries;
using SciChart.Charting3D;
using SciChart.Charting3D.Interop;
using SciChart.Charting3D.Primitives;
using SciChart.Core.Extensions;
namespace SciChart.Examples.Examples.SeeFeaturedApplication.Antenna3DRadiationPattern
{
/// <summary>
/// Closed triangulated mesh for a 3-D antenna radiation pattern.
///
/// Each (theta × phi) quad is split into two triangles. All geometry,
/// normals, and colours are precomputed once in the constructor because the
/// gain data is static. RenderScene only submits the cached triangles.
///
/// Per-triangle normals are computed via the cross product of the two edge
/// vectors. The sign is resolved against the analytic outward direction in
/// spherical coordinates — sin(θ)cos(φ), cos(θ), sin(θ)sin(φ) — so it
/// stays robust near the equatorial gain-zero ring where vertices collapse
/// toward the origin.
/// </summary>
public class AntennaGainMeshEntity : BaseSceneEntity<SCRTSceneEntity>
{
// Pre-transformed triangle with flat (per-face) normal and per-vertex colour.
private struct CachedTriangle
{
public Vector3 Normal;
public Color C0, C1, C2;
public Vector3 V0, V1, V2;
}
private readonly CachedTriangle[] _triangles;
/// <param name="gain">Normalised gain grid [theta, phi] in [0,1].</param>
/// <param name="thetaCount">Number of elevation samples (0 to π inclusive).</param>
/// <param name="phiCount">Number of azimuth samples (0 to 2π, last wraps to first).</param>
/// <param name="scale">Data-space radius multiplier for the peak lobe.</param>
/// <param name="palette">Colour palette mapping dBi values to vertex colours.</param>
public AntennaGainMeshEntity(double[,] gain, int thetaCount, int phiCount,
double scale, HeatmapColorPalette palette)
: base(new SCRTSceneEntity())
{
_triangles = BuildTriangles(gain, thetaCount, phiCount, scale, palette,
out double minX, out double maxX, out double minY, out double maxY,
out double minZ, out double maxZ);
MinX = minX; MaxX = maxX;
MinY = minY; MaxY = maxY;
MinZ = minZ; MaxZ = maxZ;
}
// Cartesian bounding box of the mesh, used to size axis VisibleRanges.
public double MinX { get; }
public double MaxX { get; }
public double MinY { get; }
public double MaxY { get; }
public double MinZ { get; }
public double MaxZ { get; }
public override eSCRTSceneEntityKind GetKind() =>
eSCRTSceneEntityKind.SCRT_SCENE_ENTITY_KIND_OPAQUE;
public override void RenderScene(IRenderPassInfo3D rpi)
{
using (var mesh = BeginLitMesh(TSRRenderMode.TRIANGLES))
{
VXccelEngine3D.PushRasterizerState(
RasterizerStates.Default.TSRRasterizerState);
float xOff = rpi.WorldDimensions.X * 0.5f;
float zOff = rpi.WorldDimensions.Z * 0.5f;
foreach (var t in _triangles)
{
// Transform data-space vertices through axis coordinate calculators
// so the mesh responds to VisibleRange changes on all three axes.
// X and Z need the world-center offset (GetCoordinate returns [0,WD],
// but the axis cube spans [-WD/2,+WD/2] for X and Z).
float wx0 = (float)rpi.XCalc.GetCoordinate(t.V0.X) - xOff;
float wy0 = (float)rpi.YCalc.GetCoordinate(t.V0.Y);
float wz0 = (float)rpi.ZCalc.GetCoordinate(t.V0.Z) - zOff;
float wx1 = (float)rpi.XCalc.GetCoordinate(t.V1.X) - xOff;
float wy1 = (float)rpi.YCalc.GetCoordinate(t.V1.Y);
float wz1 = (float)rpi.ZCalc.GetCoordinate(t.V1.Z) - zOff;
float wx2 = (float)rpi.XCalc.GetCoordinate(t.V2.X) - xOff;
float wy2 = (float)rpi.YCalc.GetCoordinate(t.V2.Y);
float wz2 = (float)rpi.ZCalc.GetCoordinate(t.V2.Z) - zOff;
mesh.Normal3(t.Normal.X, t.Normal.Y, t.Normal.Z);
mesh.SetVertexColor(t.C0); mesh.SetVertex3(wx0, wy0, wz0);
mesh.SetVertexColor(t.C1); mesh.SetVertex3(wx1, wy1, wz1);
mesh.SetVertexColor(t.C2); mesh.SetVertex3(wx2, wy2, wz2);
}
}
VXccelEngine3D.PopRasterizerState();
}
private static CachedTriangle[] BuildTriangles(double[,] gain, int thetaCount,
int phiCount, double scale,
HeatmapColorPalette palette,
out double minX, out double maxX,
out double minY, out double maxY,
out double minZ, out double maxZ)
{
// Angular step sizes: θ spans [0,π], φ spans [0,2π) and wraps.
double dTheta = Math.PI / (thetaCount - 1);
double dPhi = 2.0 * Math.PI / phiCount;
// Compute Cartesian bounding box over all mesh vertices.
minX = double.MaxValue; maxX = double.MinValue;
minY = double.MaxValue; maxY = double.MinValue;
minZ = double.MaxValue; maxZ = double.MinValue;
for (int ti = 0; ti < thetaCount; ti++)
{
double theta = ti * dTheta;
double sinT = Math.Sin(theta), cosT = Math.Cos(theta);
for (int pi = 0; pi < phiCount; pi++)
{
double r = gain[ti, pi] * scale;
double x = r * sinT * Math.Cos(pi * dPhi);
double y = r * cosT;
double z = r * sinT * Math.Sin(pi * dPhi);
if (x < minX) minX = x; if (x > maxX) maxX = x;
if (y < minY) minY = y; if (y > maxY) maxY = y;
if (z < minZ) minZ = z; if (z > maxZ) maxZ = z;
}
}
// Each (θ,φ) quad → 2 triangles; φ wraps so every row is a closed ring.
var triangles = new CachedTriangle[(thetaCount - 1) * phiCount * 2];
int idx = 0;
for (int ti = 0; ti < thetaCount - 1; ti++)
{
for (int pi = 0; pi < phiCount; pi++)
{
int pi1 = (pi + 1) % phiCount; // wrap azimuth
double theta0 = ti * dTheta;
double theta1 = (ti + 1) * dTheta;
double phi0 = pi * dPhi;
double phi1 = pi1 * dPhi;
// Four corners of this quad in Cartesian space.
Vector3 v00 = ToWorld(gain[ti, pi ] * scale, theta0, phi0);
Vector3 v10 = ToWorld(gain[ti + 1, pi ] * scale, theta1, phi0);
Vector3 v01 = ToWorld(gain[ti, pi1] * scale, theta0, phi1);
Vector3 v11 = ToWorld(gain[ti + 1, pi1] * scale, theta1, phi1);
// Map each vertex gain (normalised) → dBi → palette colour.
Color c00 = palette.GetColor(AntennaMetrics.ToDbi(gain[ti, pi ])).ToColor();
Color c10 = palette.GetColor(AntennaMetrics.ToDbi(gain[ti + 1, pi ])).ToColor();
Color c01 = palette.GetColor(AntennaMetrics.ToDbi(gain[ti, pi1])).ToColor();
Color c11 = palette.GetColor(AntennaMetrics.ToDbi(gain[ti + 1, pi1])).ToColor();
// Analytic outward direction at the quad centre — used to orient normals.
// Derived from spherical coords so it remains valid even when gain ≈ 0.
float refX = (float)(Math.Sin((theta0 + theta1) * 0.5) * Math.Cos((phi0 + phi1) * 0.5));
float refY = (float)(Math.Cos((theta0 + theta1) * 0.5));
float refZ = (float)(Math.Sin((theta0 + theta1) * 0.5) * Math.Sin((phi0 + phi1) * 0.5));
triangles[idx++] = new CachedTriangle
{
Normal = SurfaceNormal(v00, v01, v10, refX, refY, refZ),
C0 = c00, C1 = c01, C2 = c10,
V0 = v00, V1 = v01, V2 = v10
};
triangles[idx++] = new CachedTriangle
{
Normal = SurfaceNormal(v10, v01, v11, refX, refY, refZ),
C0 = c10, C1 = c01, C2 = c11,
V0 = v10, V1 = v01, V2 = v11
};
}
}
return triangles;
}
/// <summary>
/// Computes the unit normal of triangle (a, b, c) that is orthogonal to the
/// mesh surface. The sign is resolved by the caller-supplied analytic outward
/// reference (refX, refY, refZ), which is the spherical-coordinate outward
/// direction at the quad centre — always well-defined, never near-zero.
/// Falls back to the reference vector itself for degenerate (zero-area) triangles.
/// </summary>
private static Vector3 SurfaceNormal(Vector3 a, Vector3 b, Vector3 c,
float refX, float refY, float refZ)
{
float e1x = b.X - a.X, e1y = b.Y - a.Y, e1z = b.Z - a.Z;
float e2x = c.X - a.X, e2y = c.Y - a.Y, e2z = c.Z - a.Z;
float nx = e1y * e2z - e1z * e2y;
float ny = e1z * e2x - e1x * e2z;
float nz = e1x * e2y - e1y * e2x;
float len = (float)Math.Sqrt(nx * nx + ny * ny + nz * nz);
// Degenerate triangle (near-zero area) — use the analytic fallback.
if (len < 1e-6f)
return new Vector3(refX, refY, refZ);
nx /= len; ny /= len; nz /= len;
// Flip if the cross-product normal points inward relative to the
// analytic outward direction. This is always a reliable test because
// (refX, refY, refZ) is derived from the angular coordinates, not from
// the vertex positions, so it stays well-conditioned near gain = 0.
if (nx * refX + ny * refY + nz * refZ < 0)
{ nx = -nx; ny = -ny; nz = -nz; }
return new Vector3(nx, ny, nz);
}
// Spherical → Cartesian. Convention: main beam along +Y (θ=0), φ rotates in XZ.
private static Vector3 ToWorld(double r, double theta, double phi)
{
float x = (float)(r * Math.Sin(theta) * Math.Cos(phi));
float y = (float)(r * Math.Cos(theta));
float z = (float)(r * Math.Sin(theta) * Math.Sin(phi));
return new Vector3(x, y, z);
}
}
}
GainCoverageChartsView.xaml
View source code<UserControl x:Class="SciChart.Examples.Examples.SeeFeaturedApplication.Antenna3DRadiationPattern.GainCoverageChartsView"
xmlns="http://schemas.microsoft.com/winfx/2006/xaml/presentation"
xmlns:x="http://schemas.microsoft.com/winfx/2006/xaml"
xmlns:s="http://schemas.abtsoftware.co.uk/scichart"
>
<UserControl.Resources>
<ResourceDictionary>
<ResourceDictionary.MergedDictionaries>
<!-- Shared gain color palette used by the heatmap -->
<ResourceDictionary Source="AntennaSharedResources.xaml" />
</ResourceDictionary.MergedDictionaries>
<!-- Tooltip template for the gain heatmap: shows φ, θ and gain in dBi -->
<DataTemplate x:Key="GainCoverageTooltipTemplate" DataType="s:HeatmapSeriesInfo">
<StackPanel Margin="5,3">
<TextBlock Foreground="#E0FFFFFF" FontSize="13">
<Run Text="φ " /><Run Text="{Binding FormattedXValue, Mode=OneWay}" />
<Run Text="° θ " /><Run Text="{Binding FormattedYValue, Mode=OneWay}" /><Run Text="°" />
</TextBlock>
<TextBlock Foreground="#E0FFFFFF" FontSize="13">
<Run Text="Gain " /><Run Text="{Binding FormattedZValue, Mode=OneWay}" /><Run Text=" dBi" />
</TextBlock>
</StackPanel>
</DataTemplate>
<!-- Applied to fan chart series when IsSelected=true (annotation is grabbed) -->
<Style x:Key="SelectedLineSeriesStyle" TargetType="s:FastLineRenderableSeries">
<Setter Property="StrokeThickness" Value="3" />
</Style>
</ResourceDictionary>
</UserControl.Resources>
<Grid Margin="0,8,0,0">
<Grid.RowDefinitions>
<RowDefinition Height="*" />
<RowDefinition Height="*" />
</Grid.RowDefinitions>
<!-- Top: gain cut line chart with E-plane (φ cut) and H-plane (θ cut) traces -->
<s:SciChartSurface x:Name="fanChart"
Grid.Row="0"
BorderThickness="0"
s:SciChartGroup.VerticalChartGroup="GainCoverageChartsGroup">
<s:SciChartSurface.RenderableSeries>
<!-- H-plane cut line: gain vs φ at a fixed θ (orange) -->
<s:FastLineRenderableSeries x:Name="thetaCutSeries" XAxisId="PhiXAxis" YAxisId="GainAxis"
Stroke="#FFFF8040" StrokeThickness="1"
SelectedSeriesStyle="{StaticResource SelectedLineSeriesStyle}" />
<!-- E-plane cut line: gain vs θ at a fixed φ (blue) -->
<s:FastLineRenderableSeries x:Name="phiCutSeries" XAxisId="ThetaXAxis" YAxisId="GainAxis"
Stroke="#FF4080FF" StrokeThickness="1"
SelectedSeriesStyle="{StaticResource SelectedLineSeriesStyle}" />
</s:SciChartSurface.RenderableSeries>
<s:SciChartSurface.XAxes>
<!-- Bottom axis: θ range 0°–180° for the E-plane cut -->
<s:NumericAxis Id="ThetaXAxis" AxisTitle="θ (°)" AxisAlignment="Bottom"
IsPrimaryAxis="True"
AutoRange="Never" VisibleRange="0,180"
AutoTicks="False" MajorDelta="30"
DrawMajorBands="False" DrawMinorTicks="False" DrawMinorGridLines="False" />
<!-- Top axis: φ range 0°–360° for the H-plane cut -->
<s:NumericAxis Id="PhiXAxis" AxisTitle="φ (°)" AxisAlignment="Top"
IsPrimaryAxis="False"
AutoRange="Never" VisibleRange="0,360"
AutoTicks="False" MajorDelta="30"
DrawMajorBands="False" DrawMinorTicks="False" DrawMinorGridLines="False"
DrawMajorGridLines="False" />
</s:SciChartSurface.XAxes>
<s:SciChartSurface.YAxes>
<!-- Title-only axis on the left (no data, just label) -->
<s:NumericAxis Id="TitleAxis" AxisAlignment="Left" AxisTitle="Gain Cuts"
IsPrimaryAxis="False" DrawLabels="False" DrawMajorTicks="False" DrawMinorTicks="False"
DrawMajorGridLines="False" DrawMinorGridLines="False" DrawMajorBands="False"
AutoRange="Never" VisibleRange="0,1" BorderThickness="0" />
<!-- Gain axis in dBi: range matches the color palette (-40 to +3 dBi) -->
<s:NumericAxis Id="GainAxis" AxisAlignment="Right" AxisTitle="Gain (dBi)"
IsPrimaryAxis="True" AutoRange="Never" VisibleRange="-40,3"
AutoTicks="False" MajorDelta="10"
DrawMajorBands="False" DrawMinorTicks="False" DrawMinorGridLines="False" />
</s:SciChartSurface.YAxes>
<s:SciChartSurface.ChartModifier>
<s:ModifierGroup MouseEventGroup="GainCoverageModifierGroup">
<s:LegendModifier ShowLegend="True" LegendPlacement="Inside" GetLegendDataFor="AllSeries" Orientation="Vertical" />
<s:RolloverModifier ShowTooltipOn="MouseHover" />
</s:ModifierGroup>
</s:SciChartSurface.ChartModifier>
</s:SciChartSurface>
<!-- Bottom: gain coverage heatmap (φ × θ) with draggable cross-section lines -->
<s:SciChartSurface x:Name="gainHeatmap"
Grid.Row="1"
BorderThickness="0"
s:SciChartGroup.VerticalChartGroup="GainCoverageChartsGroup">
<s:SciChartSurface.RenderableSeries>
<!-- Heatmap of gain in dBi across the full (φ, θ) grid -->
<s:FastUniformHeatmapRenderableSeries x:Name="gainHeatmapSeries"
YAxisId="ThetaAxis"
ColorMap="{StaticResource GainColorPalette}"
UseLinearTextureFiltering="True"
Opacity="0.95"
s:TooltipModifier.TooltipTemplate="{StaticResource GainCoverageTooltipTemplate}" />
</s:SciChartSurface.RenderableSeries>
<s:SciChartSurface.XAxis>
<s:NumericAxis AxisTitle="φ (°)" AxisAlignment="Right"
DrawMinorTicks="False" DrawMajorTicks="False" DrawMajorBands="False"
AutoRange="Never" VisibleRange="0,360" AutoTicks="False" MajorDelta="30" />
</s:SciChartSurface.XAxis>
<s:SciChartSurface.YAxes>
<s:NumericAxis Id="TitleAxis" AxisAlignment="Left" AxisTitle="Gain Coverage Map"
IsPrimaryAxis="False" DrawLabels="False" DrawMajorTicks="False" DrawMinorTicks="False"
DrawMajorGridLines="False" DrawMinorGridLines="False" DrawMajorBands="False"
AutoRange="Never" VisibleRange="0,1" BorderThickness="0" />
<s:NumericAxis Id="ThetaAxis" AxisAlignment="Top"
IsPrimaryAxis="True" AutoRange="Never" VisibleRange="0,180"
DrawMinorTicks="False" DrawMajorTicks="False" DrawMajorBands="False"
AutoTicks="False" MajorDelta="30" />
</s:SciChartSurface.YAxes>
<s:SciChartSurface.Annotations>
<!-- Draggable cross-section lines bound to the toolbar sliders -->
<s:VerticalLineAnnotation x:Name="thetaLine"
YAxisId="ThetaAxis"
Stroke="#CCFF8040"
StrokeThickness="1.5"
StrokeDashArray="4 2"
IsEditable="True" />
<s:HorizontalLineAnnotation x:Name="phiLine"
YAxisId="ThetaAxis"
Stroke="#CC4080FF"
StrokeThickness="1.5"
StrokeDashArray="4 2"
IsEditable="True" />
</s:SciChartSurface.Annotations>
<s:SciChartSurface.ChartModifier>
<s:ModifierGroup MouseEventGroup="GainCoverageModifierGroup">
<s:TooltipModifier UseInterpolation="True" />
</s:ModifierGroup>
</s:SciChartSurface.ChartModifier>
</s:SciChartSurface>
</Grid>
</UserControl>
PolarChartsView.xaml
View source code<UserControl x:Class="SciChart.Examples.Examples.SeeFeaturedApplication.Antenna3DRadiationPattern.PolarChartsView"
xmlns="http://schemas.microsoft.com/winfx/2006/xaml/presentation"
xmlns:x="http://schemas.microsoft.com/winfx/2006/xaml"
xmlns:s="http://schemas.abtsoftware.co.uk/scichart">
<UserControl.Resources>
<!-- Radial grid line style for the polar chart concentric rings -->
<Style x:Key="PolarRadialGridLineStyle" TargetType="Line">
<Setter Property="Stroke" Value="#55FFFFFF" />
<Setter Property="StrokeThickness" Value="2" />
</Style>
<Style x:Key="AxisTickStyle" TargetType="Line">
<Setter Property="Stroke" Value="#93A3C5" />
<Setter Property="StrokeThickness" Value="1" />
</Style>
</UserControl.Resources>
<Grid Margin="0,8,0,0">
<Grid.RowDefinitions>
<RowDefinition Height="*" />
<RowDefinition Height="*" />
</Grid.RowDefinitions>
<!-- Top: E-plane (elevation) polar chart — gain vs θ at a fixed φ -->
<s:SciChartSurface x:Name="elevationChart" Grid.Row="0" BorderThickness="0">
<s:SciChartSurface.RenderableSeries>
<s:FastLineRenderableSeries x:Name="elevationSeries" Stroke="#FF00AAFF" StrokeThickness="1" />
</s:SciChartSurface.RenderableSeries>
<s:SciChartSurface.XAxis>
<!-- Angular axis: 0°–359° with 30° ticks, rotated so 0° is at top -->
<s:PolarXAxis AutoRange="Never" VisibleRange="0,359"
AutoTicks="False" MajorDelta="30"
BorderThickness="1,0,0,0" BorderBrush="#93A3C5"
DrawMinorGridLines="False" DrawMinorTicks="False"
CursorTextFormatting="###"
MajorTickLineStyle="{StaticResource AxisTickStyle}"
RotationAngle="90" />
</s:SciChartSurface.XAxis>
<s:SciChartSurface.YAxes>
<!-- Radial axis: gain in dBi, range matches the color palette -->
<s:PolarYAxis IsPrimaryAxis="True"
AutoRange="Never" VisibleRange="-40,3"
AutoTicks="False" MajorDelta="3"
DrawLabels="True" DrawMajorGridLines="True" DrawMinorGridLines="False" DrawMinorTicks="False"
BorderBrush="#93A3C5" BorderThickness="1,0,0,0"
TextFormatting="0" AxisTitle="dBi"
MajorTickLineStyle="{StaticResource AxisTickStyle}"
MajorGridLineStyle="{StaticResource PolarRadialGridLineStyle}" />
<!-- Title-only axis on the right: displays current cut angle -->
<s:NumericAxis x:Name="elevationTitleAxis" Id="TitleAxis" AxisAlignment="Right"
AxisTitle="E-plane (φ = 0°)"
IsPrimaryAxis="False" DrawLabels="False" DrawMajorTicks="False" DrawMinorTicks="False"
DrawMajorGridLines="False" DrawMinorGridLines="False" DrawMajorBands="False"
AutoRange="Never" VisibleRange="0,1" BorderThickness="0" />
</s:SciChartSurface.YAxes>
<s:SciChartSurface.ChartModifier>
<s:ModifierGroup>
<s:RolloverModifier ShowTooltipOn="Always" />
</s:ModifierGroup>
</s:SciChartSurface.ChartModifier>
</s:SciChartSurface>
<!-- Bottom: H-plane (azimuth) polar chart — gain vs φ at a fixed θ -->
<s:SciChartSurface x:Name="azimuthChart" Grid.Row="1" BorderThickness="0">
<s:SciChartSurface.RenderableSeries>
<s:FastLineRenderableSeries x:Name="azimuthSeries" Stroke="#FFFF6600" StrokeThickness="1" />
</s:SciChartSurface.RenderableSeries>
<s:SciChartSurface.XAxis>
<!-- Angular axis: 0°–359° with 30° ticks, rotated so 0° is at top -->
<s:PolarXAxis AutoRange="Never" VisibleRange="0,359"
AutoTicks="False" MajorDelta="30"
BorderThickness="1,0,0,0" BorderBrush="#93A3C5"
DrawMinorGridLines="False" DrawMinorTicks="False"
CursorTextFormatting="###"
MajorTickLineStyle="{StaticResource AxisTickStyle}"
RotationAngle="90" />
</s:SciChartSurface.XAxis>
<s:SciChartSurface.YAxes>
<!-- Radial axis: gain in dBi, range matches the color palette -->
<s:PolarYAxis IsPrimaryAxis="True"
AutoRange="Never" BorderBrush="#93A3C5" BorderThickness="1,0,0,0"
VisibleRange="-40,3"
AutoTicks="False" MajorDelta="3"
DrawLabels="True" DrawMajorGridLines="True" DrawMinorGridLines="False" DrawMinorTicks="False"
TextFormatting="0" AxisTitle="dBi"
MajorTickLineStyle="{StaticResource AxisTickStyle}"
MajorGridLineStyle="{StaticResource PolarRadialGridLineStyle}" />
<!-- Title-only axis on the right: displays current cut angle -->
<s:NumericAxis x:Name="azimuthTitleAxis" Id="TitleAxis" AxisAlignment="Right"
AxisTitle="H-plane (θ = 22°)"
IsPrimaryAxis="False" DrawLabels="False" DrawMajorTicks="False" DrawMinorTicks="False"
DrawMajorGridLines="False" DrawMinorGridLines="False" DrawMajorBands="False"
AutoRange="Never" VisibleRange="0,1" BorderThickness="0" />
</s:SciChartSurface.YAxes>
<s:SciChartSurface.ChartModifier>
<s:ModifierGroup>
<s:RolloverModifier ShowTooltipOn="Always" />
</s:ModifierGroup>
</s:SciChartSurface.ChartModifier>
</s:SciChartSurface>
</Grid>
</UserControl>
AntennaMetrics.cs
View source code// *************************************************************************************
// SCICHART® Copyright SciChart Ltd. 2011-2026. All rights reserved.
//
// Web: http://www.scichart.com
// Support: support@scichart.com
// Sales: sales@scichart.com
//
// AntennaMetrics.cs is part of the SCICHART® Examples. Permission is hereby granted
// to modify, create derivative works, distribute and publish any part of this source
// code whether for commercial, private or personal use.
//
// The SCICHART® examples are distributed in the hope that they will be useful, but
// without any warranty. It is provided "AS IS" without warranty of any kind, either
// expressed or implied.
// *************************************************************************************
using System;
using System.ComponentModel;
using System.Runtime.CompilerServices;
namespace SciChart.Examples.Examples.SeeFeaturedApplication.Antenna3DRadiationPattern
{
/// <summary>
/// Scalar figures-of-merit derived from the antenna gain grid.
/// Bound into the LegendModifier3D metrics panel via LegendTemplate.
/// </summary>
public class AntennaMetrics : INotifyPropertyChanged
{
// Gain is stored normalised to [0,1]; DbiRange maps that to [-40, 0] dBi.
public const double DbiRange = 40.0;
public static double ToDbi(double normalizedGain) => normalizedGain * DbiRange - DbiRange;
public static double ToRadians(double degrees) => degrees * Math.PI / 180.0;
public static double ToDegrees(double radians) => radians * 180.0 / Math.PI;
// All metric strings default to "—" (em-dash) until computed.
private string _peakGain = "—";
private string _hpbwEPlane = "—";
private string _hpbwHPlane = "—";
private string _firstSll = "—";
private string _frontToBack = "—";
/// <summary>Maximum gain across the entire pattern, in dBi.</summary>
public string PeakGain
{
get => _peakGain;
set { _peakGain = value; OnPropertyChanged(); }
}
/// <summary>Half-power beamwidth in the E-plane (constant φ cut), in degrees.</summary>
public string HpbwEPlane
{
get => _hpbwEPlane;
set { _hpbwEPlane = value; OnPropertyChanged(); }
}
/// <summary>Half-power beamwidth in the H-plane (constant θ cut), in degrees.</summary>
public string HpbwHPlane
{
get => _hpbwHPlane;
set { _hpbwHPlane = value; OnPropertyChanged(); }
}
/// <summary>First sidelobe level relative to the main lobe peak, in dB.</summary>
public string FirstSll
{
get => _firstSll;
set { _firstSll = value; OnPropertyChanged(); }
}
/// <summary>Front-to-back ratio: peak forward gain vs peak rearward gain, in dB.</summary>
public string FrontToBack
{
get => _frontToBack;
set { _frontToBack = value; OnPropertyChanged(); }
}
public event PropertyChangedEventHandler PropertyChanged;
private void OnPropertyChanged([CallerMemberName] string name = null) =>
PropertyChanged?.Invoke(this, new PropertyChangedEventArgs(name));
}
}



